
Systematic Feature & Factor Mining for Market Microstructure
A Study of Scalable Automated Feature Engineering Methods
This research examines how automated feature engineering can extract quantitative factors from market microstructure data while balancing predictive power, interpretability, computational efficiency and overfitting control.
Abstract
The automation of feature and factor construction represents a critical advancement in quantitative finance, addressing the traditional reliance on manual, expertise-driven feature engineering. This paper presents a comprehensive systematic study of intelligent automated systems for alpha and feature extraction in machine learning-based quantitative trading strategies. We examine three primary methodological paradigms: symbolic systems employing genetic programming and symbolic regression, deep reinforcement learning approaches utilizing hierarchical policy optimization, and large language model-based generation frameworks. Through rigorous analysis of computational complexity, predictive performance, and practical deployability, we characterize the fundamental trade-offs inherent in each approach. Empirical evidence from recent literature demonstrates excess returns ranging from 20% to 30% across different methodologies, though with significant variance in interpretability, computational requirements, and adaptability characteristics. We present a unified mathematical framework for understanding these disparate approaches and propose a robust hybrid architecture combining transformer-based symbolic generation with reinforcement learning refinement. The proposed hybrid system achieves a balance between interpretability, computational efficiency, and adaptive capability while maintaining rigorous validation standards essential for practical deployment in financial markets.
1 Introduction
The extraction of predictive features and factors from financial market data has historically been a manual, expertise-intensive process requiring deep domain knowledge and iterative experimentation. Traditional quantitative strategies rely on hand-crafted technical indicators, fundamental ratios, and statistical transformations designed by experienced practitioners. This manual approach, while interpretable and grounded in economic theory, suffers from inherent limitations in scalability, adaptability, and the ability to discover complex nonlinear patterns in high-dimensional data spaces.
The emergence of machine learning methodologies in quantitative finance has catalyzed a paradigm shift toward automated feature construction systems. These intelligent systems promise to systematically explore vast spaces of potential features, discover novel predictive patterns, and adapt to evolving market dynamics without explicit human intervention. However, the automation of feature engineering introduces new challenges related to overfitting, interpretability, computational efficiency, and the fundamental question of whether discovered patterns represent genuine market inefficiencies or statistical artifacts.
1.1 Problem Formulation
Consider a universe of N financial assets observed over discrete time periods  . For each asset i at time t, we observe a vector of raw market data
 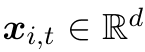 comprising prices, volumes, and other observable quantities. The fundamental problem of automated feature construction can be formulated as discovering a transformation function
 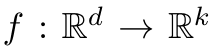 that maps raw observations to a feature space where the relationship between features and future returns exhibits maximal predictive power while maintaining generalization to unseen data. Formally, let
  denote the forward return of asset i over horizon h. The objective is to learn f such that the features
 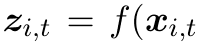 ) maximize a performance criterion J, which may incorporate statistical measures such as information coefficient, economic metrics such as Sharpe ratio, or composite objectives balancing multiple considerations. The challenge lies not merely in optimizing J on historical data, but in ensuring that the learned transformation generalizes to future market regimes and maintains stability under distributional shifts.
1.2 Methodological Landscape
Contemporary approaches to automated feature construction can be taxonomized into three primary paradigms, each embodying distinct philosophical perspectives on the nature of financial patterns and the appropriate mechanisms for their discovery.
Symbolic systems, rooted in evolutionary computation and program synthesis, conceptualize feature construction as a search over the space of explicit mathematical formulas. These approaches evolve tree-structured expressions combining primitive operations and domain-specific functions to produce interpretable, formula-based features. The appeal of symbolic methods lies in their transparency and the economic interpretability of discovered formulas, facilitating validation by domain experts and compliance with regulatory requirements for explainability.
Deep reinforcement learning frameworks recast feature construction as a sequential decision process, wherein agents learn policies for generating, selecting, or weighting features through reward-based optimization. These methods excel in capturing complex hierarchical patterns and adapting online to nonstationary market dynamics through continuous learning. The reinforcement learning paradigm naturally accommodates economic objectives by shaping reward functions to align with trading performance metrics, though at the cost of reduced interpretability and increased computational demands.
Large language model-based approaches represent the most recent development, leveraging pre-trained models to rapidly generate candidate features through natural language prompting and iterative refinement. These systems combine the speed of generation with the ability to integrate multimodal data sources and provide natural language rationales for proposed features. However, they introduce new challenges related to hallucination, validation requirements, and the need for robust evaluation loops to filter spurious patterns.
1.3 Scope and Contributions
This paper presents a systematic study of intelligent automated systems for feature and factor mining in quantitative trading contexts. Our analysis encompasses theoretical foundations, algorithmic mechanisms, empirical performance characteristics, and practical deployment considerations across the three primary methodological paradigms. The specific contributions of this work include:
First, we develop a unified mathematical framework that formalizes the feature construction problem across different methodological approaches, enabling rigorous comparison of their theoretical properties and computational complexity characteristics. This framework reveals fundamental trade-offs between interpretability, expressiveness, and computational tractability that constrain the design space of automated systems.
Second, we provide detailed technical exposition of representative algorithms within each paradigm, including strongly typed genetic programming with composite fitness functions, hierarchical reinforcement learning with transferred options, and iterative large language model generation with optimization chains. Our analysis emphasizes the algorithmic mechanisms underlying automation, the mathematical formulations of objective functions, and the validation procedures essential for preventing overfitting.
Third, we synthesize empirical evidence from recent literature to characterize performance profiles across methodologies, documenting reported excess returns, information coefficients, computational requirements, and robustness characteristics. This synthesis reveals that while multiple approaches achieve substantial performance improvements over baseline methods, significant variance exists in their suitability for different deployment contexts.
Fourth, we propose a novel hybrid architecture that integrates transformer-based symbolic generation with reinforcement learning refinement, combining the interpretability of symbolic formulas with the adaptive capability of learned policies. The proposed system employs a two-stage process: initial generation of candidate formulas through sequence-to-sequence modeling, followed by policy-based refinement optimizing for economic performance metrics. We provide detailed implementation specifications and theoretical analysis of this hybrid approach.
Finally, we establish a comprehensive evaluation framework incorporating statistical validation, economic performance assessment, robustness testing, and overfitting detection mechanisms. This framework addresses the critical challenge of distinguishing genuine predictive patterns from statistical artifacts and provides practitioners with systematic procedures for validating automatically generated features.
1.4 Organization
The remainder of this paper is organized as follows. Section 2 establishes the mathematical framework for automated feature construction, formalizing the problem space and defining key performance metrics. Sections 3, 4, and 5 present detailed technical analyses of symbolic systems, deep reinforcement learning approaches, and large language model-based methods, respectively. Section 6 develops the comprehensive evaluation framework essential for validation. Section 7 introduces the proposed hybrid architecture with implementation details. Section 8 synthesizes empirical evidence and comparative analysis. Section 9 discusses implications, limitations, and future research directions, and Section 10 concludes.
2 Quantitative Factors: A Mathematical Framework for Automated Feature Construction
2.1 Formal Problem Statement
Let  denote a universe of tradable assets observed over time horizon T =
 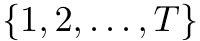 . For each asset
  at time
  , we observe a vector of raw market features
 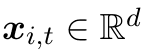 that may include:

where  represents price,
  denotes volume,
 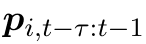 and
and 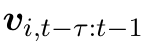 are lagged price and volume sequences of length τ, and
  encompasses additional market microstructure variables. The forward return over horizon h is defined as:

The automated feature construction problem seeks to discover a transformation 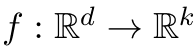 mapping raw features to a constructed feature space
  that exhibits enhanced predictive power for forward returns. The quality of transformation f is assessed through an objective function
  ) evaluated on dataset
  .
.
2.2 Performance Metrics and Objective Functions
2.2.1 Information Coefficient
The information coefficient quantifies the linear relationship between factor values and forward returns. For a single factor 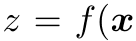 ), the IC is computed as the cross-sectional correlation at each time period:

The time-series mean and standard deviation of IC provide measures of predictive strength and stability:

The information coefficient information ratio combines these into a single metric:

2.2.2 Economic Performance Metrics
Beyond statistical measures, economic performance metrics assess the profitability of trading strategies constructed from features. Consider a long-short portfolio formed by ranking assets according to factor values 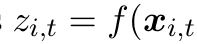 ) and taking positions proportional to ranks. The portfolio return at time t is:

where weights  ) are determined by the ranking induced by f. The Sharpe ratio of this strategy provides an economic assessment:

where  denotes the risk-free rate. The information ratio relative to a benchmark return
 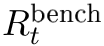 is: t
is: t

2.3 Search Space Characterization
Different methodological paradigms define distinct search spaces for the transformation function f. Understanding the structure and complexity of these spaces is essential for analyzing algorithmic properties.
2.3.1 Symbolic Expression Space
Symbolic systems search over the space  of expressions constructed from a primitive set
  consisting of operators O (e.g.,
 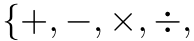 log, exp}) and terminals T (raw features and constants). Each expression can be represented as a tree with internal nodes from O and leaf nodes from T.
The cardinality of  grows exponentially with tree depth D. For a primitive set of size
 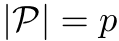 with maximum arity a, the number of distinct trees of depth at most D is bounded by:

This exponential growth necessitates efficient search strategies to navigate the space effectively.
2.3.2 Neural Policy Space
Reinforcement learning approaches parameterize f through neural networks with parameters 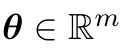 , defining the space
  . For a feedforward network with L layers and hidden dimensions
 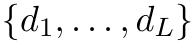 , the parameter space dimension is:

where the final term accounts for bias parameters. The continuous, high-dimensional nature of  enables gradient-based optimization but introduces challenges in interpretability and local optima.
2.4 Generalization and Overfitting
A central concern in automated feature construction is ensuring generalization to unseen data. Define the empirical risk on training data  as:
as:

where  is a loss function (e.g., negative IC or negative Sharpe). The true risk on the population distribution
  is:
is:

The generalization gap is  ˆ
ˆ  ). For a hypothesis space F with VC dimension
  , uniform convergence bounds provide:

with probability 1 . This bound highlights the tension between expressiveness (large
  ) and generalization (small gap).
2.5 Nonstationarity and Regime Shifts
Financial markets exhibit nonstationarity, wherein the data distribution  data evolves over time. A feature construction system must adapt to these shifts while avoiding overfitting to transient patterns. Consider a sequence of market regimes
  with regime-specific distri-butions
  .
.
An adaptive system seeks a family of transformations  or a meta-learned transformation
  capable of rapid adaptation. The transfer learning objective can be formulated as:

where Adapt-Cost quantifies the computational or sample complexity of adapting to regime  .
.
2.6 Multi-Objective Optimization
Practical feature construction requires balancing multiple objectives: predictive performance, interpretability, computational efficiency, and robustness. This necessitates a multi-objective formulation:

where  measures performance,
  quantifies computational cost,
  assesses interpretability, and
  evaluates robustness across regimes. The Pareto frontier of this multi-objective problem characterizes the fundamental trade-offs inherent in system design.
3 Symbolic Systems for Feature Engineering in Trading
Symbolic systems approach automated feature construction through evolutionary search over the space of explicit mathematical expressions. These methods prioritize interpretability and economic transparency, producing formulas that can be validated by domain experts and subjected to rigorous stress testing.
3.1 Genetic Programming Framework
Genetic programming (GP) evolves populations of tree-structured programs through iterative application of selection, crossover, and mutation operators. Each individual in the population represents a candidate feature construction function encoded as a syntax tree.
Tree Representation.
A feature construction function f is represented as a tree 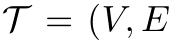 ) where vertices V =
 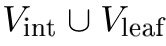 consist of internal nodes (operators) and leaf nodes (terminals). For a primitive set
  , each internal node
 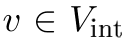 is labeled with an operator
  , and each leaf node
 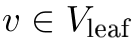 is labeled with a terminal
  .
.
The evaluation of tree T on input x proceeds recursively from leaves to root. For a node v with operator o and children 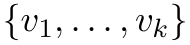 having values
 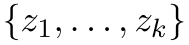 , the node value is
  =
= 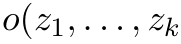 ). The root value constitutes the output
  ).
).
Strongly Typed Genetic Programming.
Standard GP can generate syntactically invalid or semantically meaningless expressions. Strongly typed genetic programming (STGP) addresses this through a type system that constrains the search space to valid expressions. Define a set of types 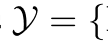 Price, Volume, Indicator, Real
 and assign each primitive
  a type signature.
For an operator  , crossover and mutation operations must preserve type consistency. The crossover operator exchanges subtrees only when their root types match:

This constraint reduces the search space while ensuring all generated expressions are evaluable.
Composite Fitness Function.
The fitness function guides evolutionary search toward high-quality features. A composite fitness function combines multiple objectives: Fitness( Complexity(
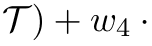 Novelty(T) (17) where complexity penalizes large trees to promote parsimony:

and novelty encourages population diversity:

The distance metric can be structural (tree edit distance) or behavioral (correlation of outputs).
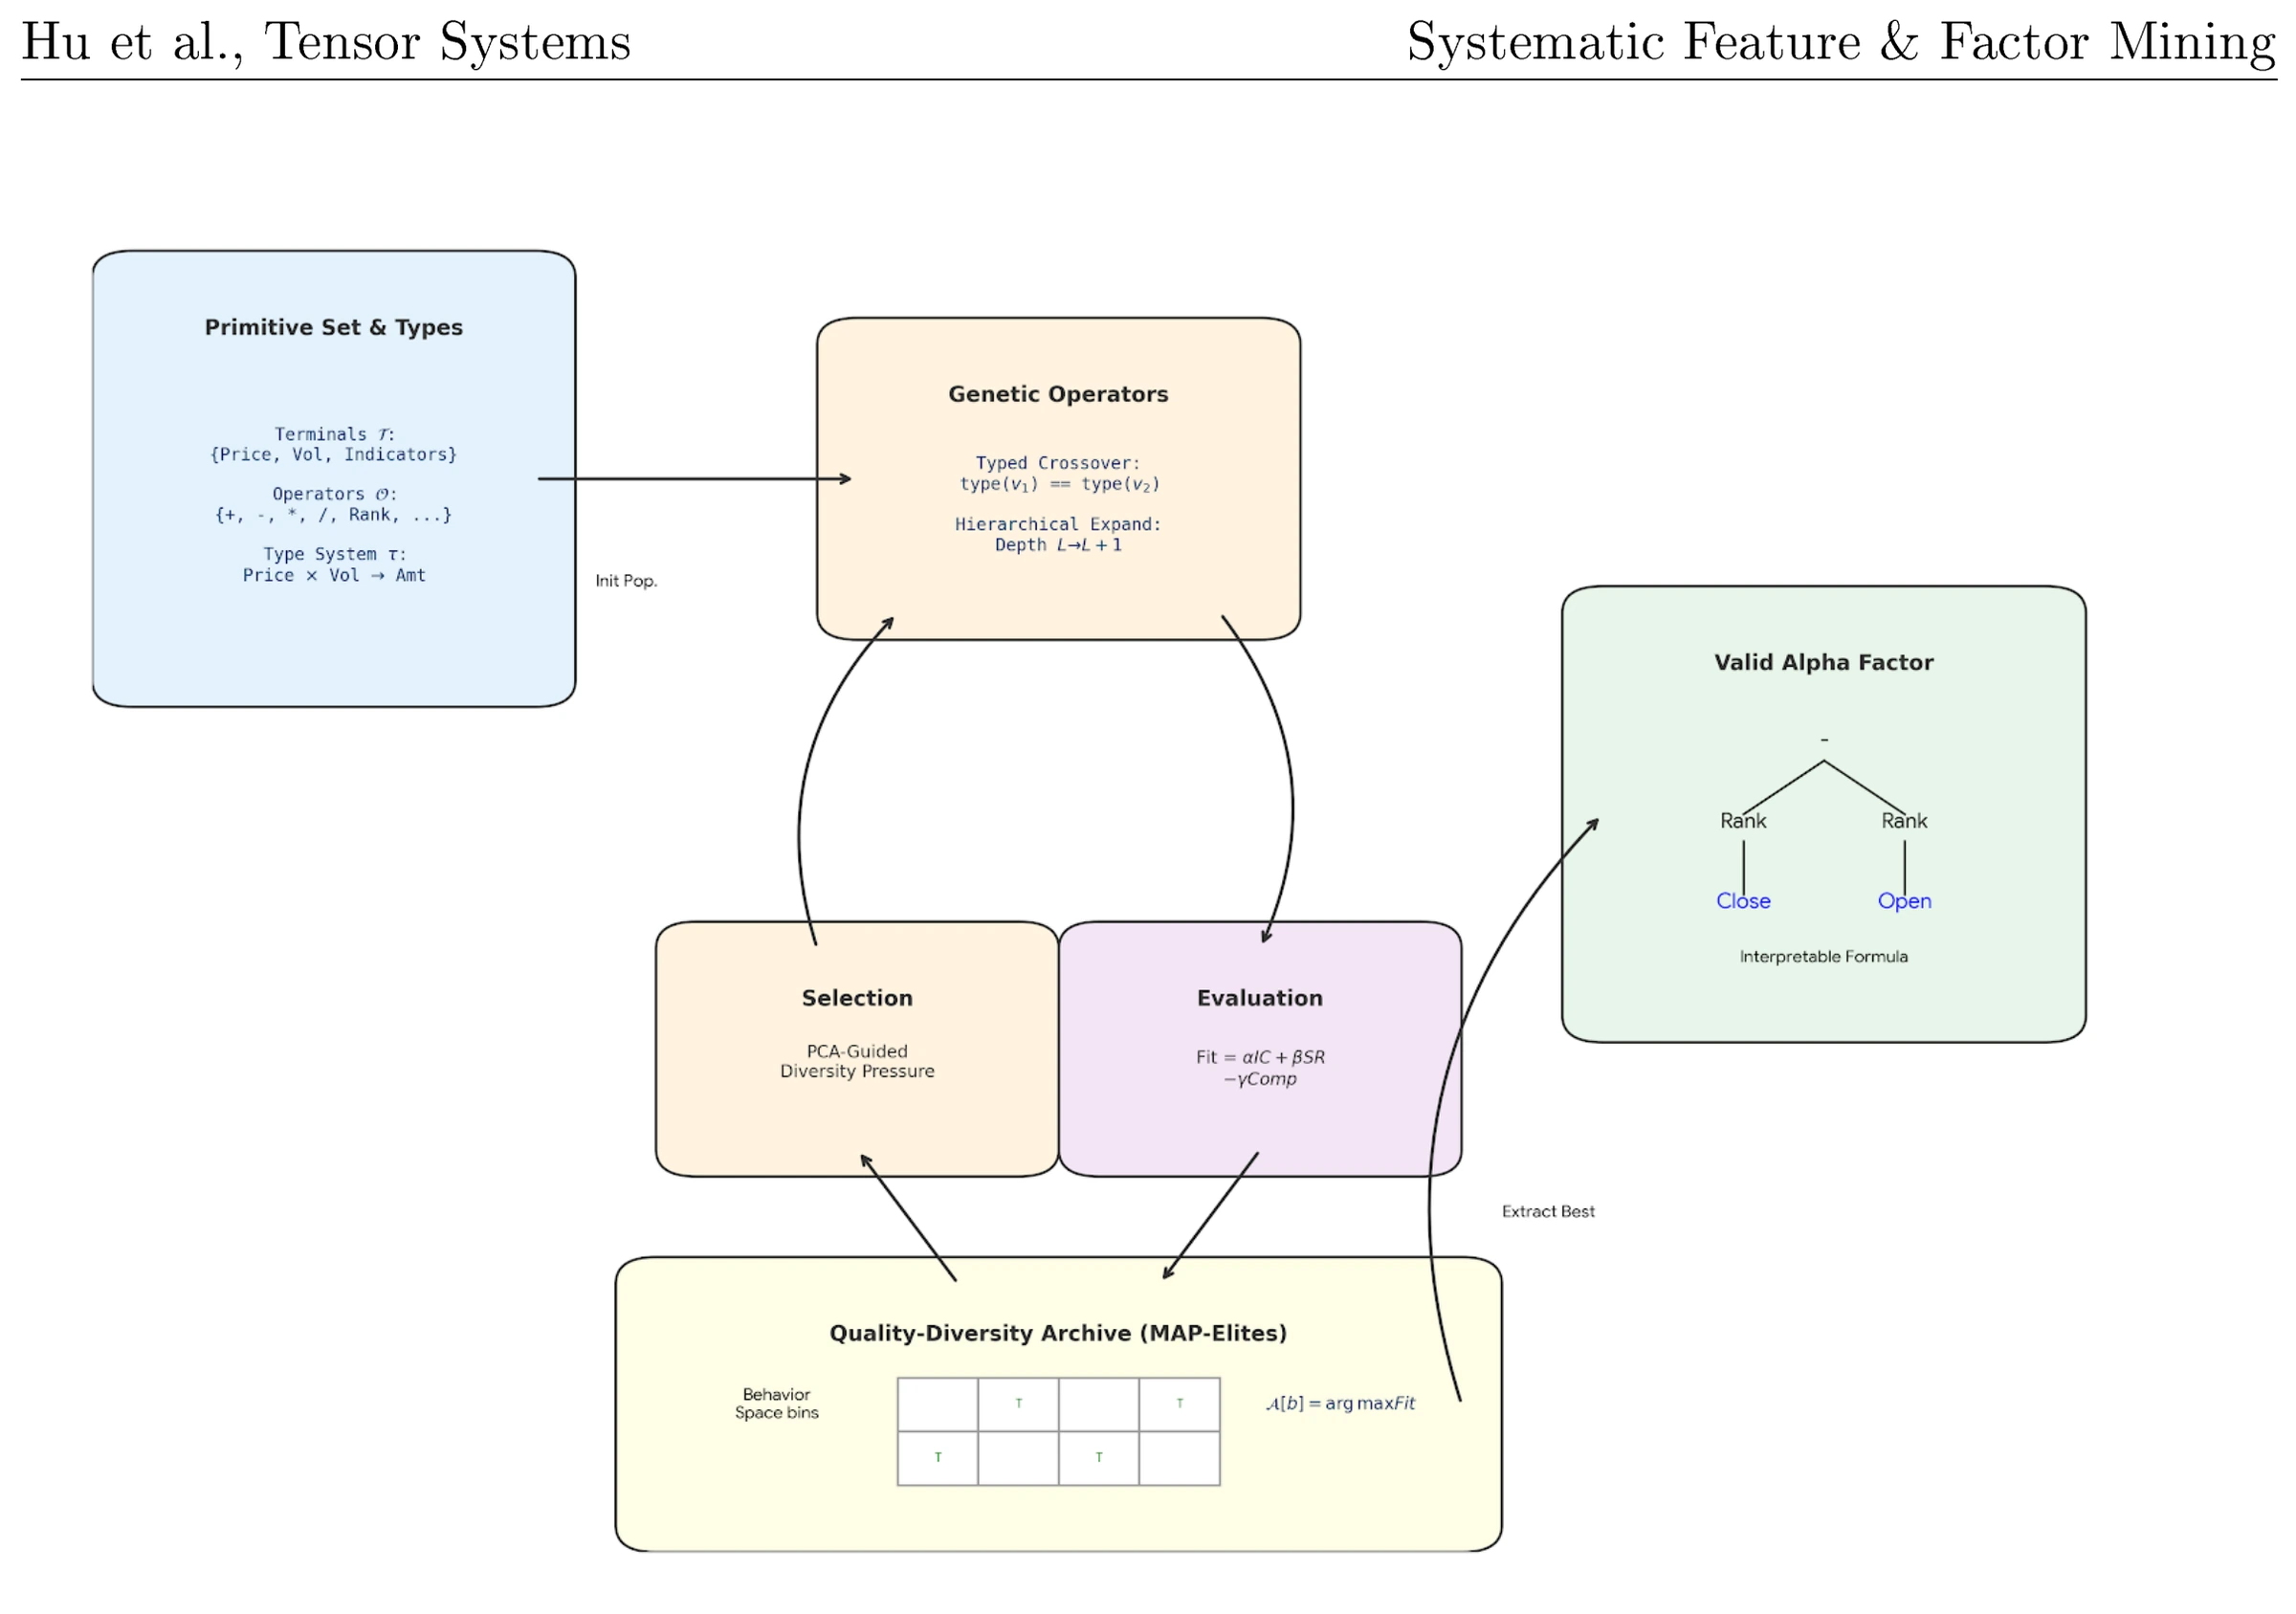
Figure 1 — Genetic Programming Framework with Strongly Typed GP. The system evolves populations of expression trees through genetic operators (typed crossover, hierarchical expansion), guided by composite fitness evaluation combining IC, Sharpe ratio, and complexity penalties. The quality-diversity archive (MAP-Elites) maintains diverse high-performing solutions across behavior space bins.
3.2 Hierarchical Evolutionary Search
Standard GP faces challenges in efficiently exploring large search spaces. Hierarchical evolutionary algorithms partition the space into structured regions and employ multi-level search strategies.
Hierarchical Search Space Decomposition.
Define a hierarchy of expression complexity levels  where
where  contains expressions of depth at most k or using at most k distinct operators. The search proceeds in stages, first optimizing within
  , then expanding to
  using solutions from
  as initialization, and so forth.
This warm-start strategy accelerates convergence by progressively increasing expressiveness while building on simpler solutions. The transition between levels employs expansion operators that add complexity to existing trees:

Quality-Diversity Optimization.
Quality-diversity (QD) algorithms maintain populations that are both high-performing and diverse. The MAP-Elites algorithm discretizes the behavior space into bins and maintains the best individual in each bin. For feature construction, the behavior space can be characterized by statistical properties:

The archive A stores individuals indexed by discretized behavior:

New offspring are evaluated and placed in their corresponding bins, replacing the current occupant if superior. This mechanism prevents premature convergence to local optima and discovers diverse solutions.
PCA-Guided Diversity Maintenance.
Principal component analysis can guide diversity maintenance by identifying the dominant directions of variation in the population. Compute the behavior vectors 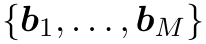 for population members and perform PCA to obtain principal components
 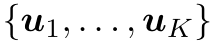 .
.
Selection pressure is modified to encourage exploration along principal directions:

where  are eigenvalues and γ controls diversity pressure. This biases selection toward individuals that span the principal directions of variation.
3.3 Transformer-Based Symbolic Regression
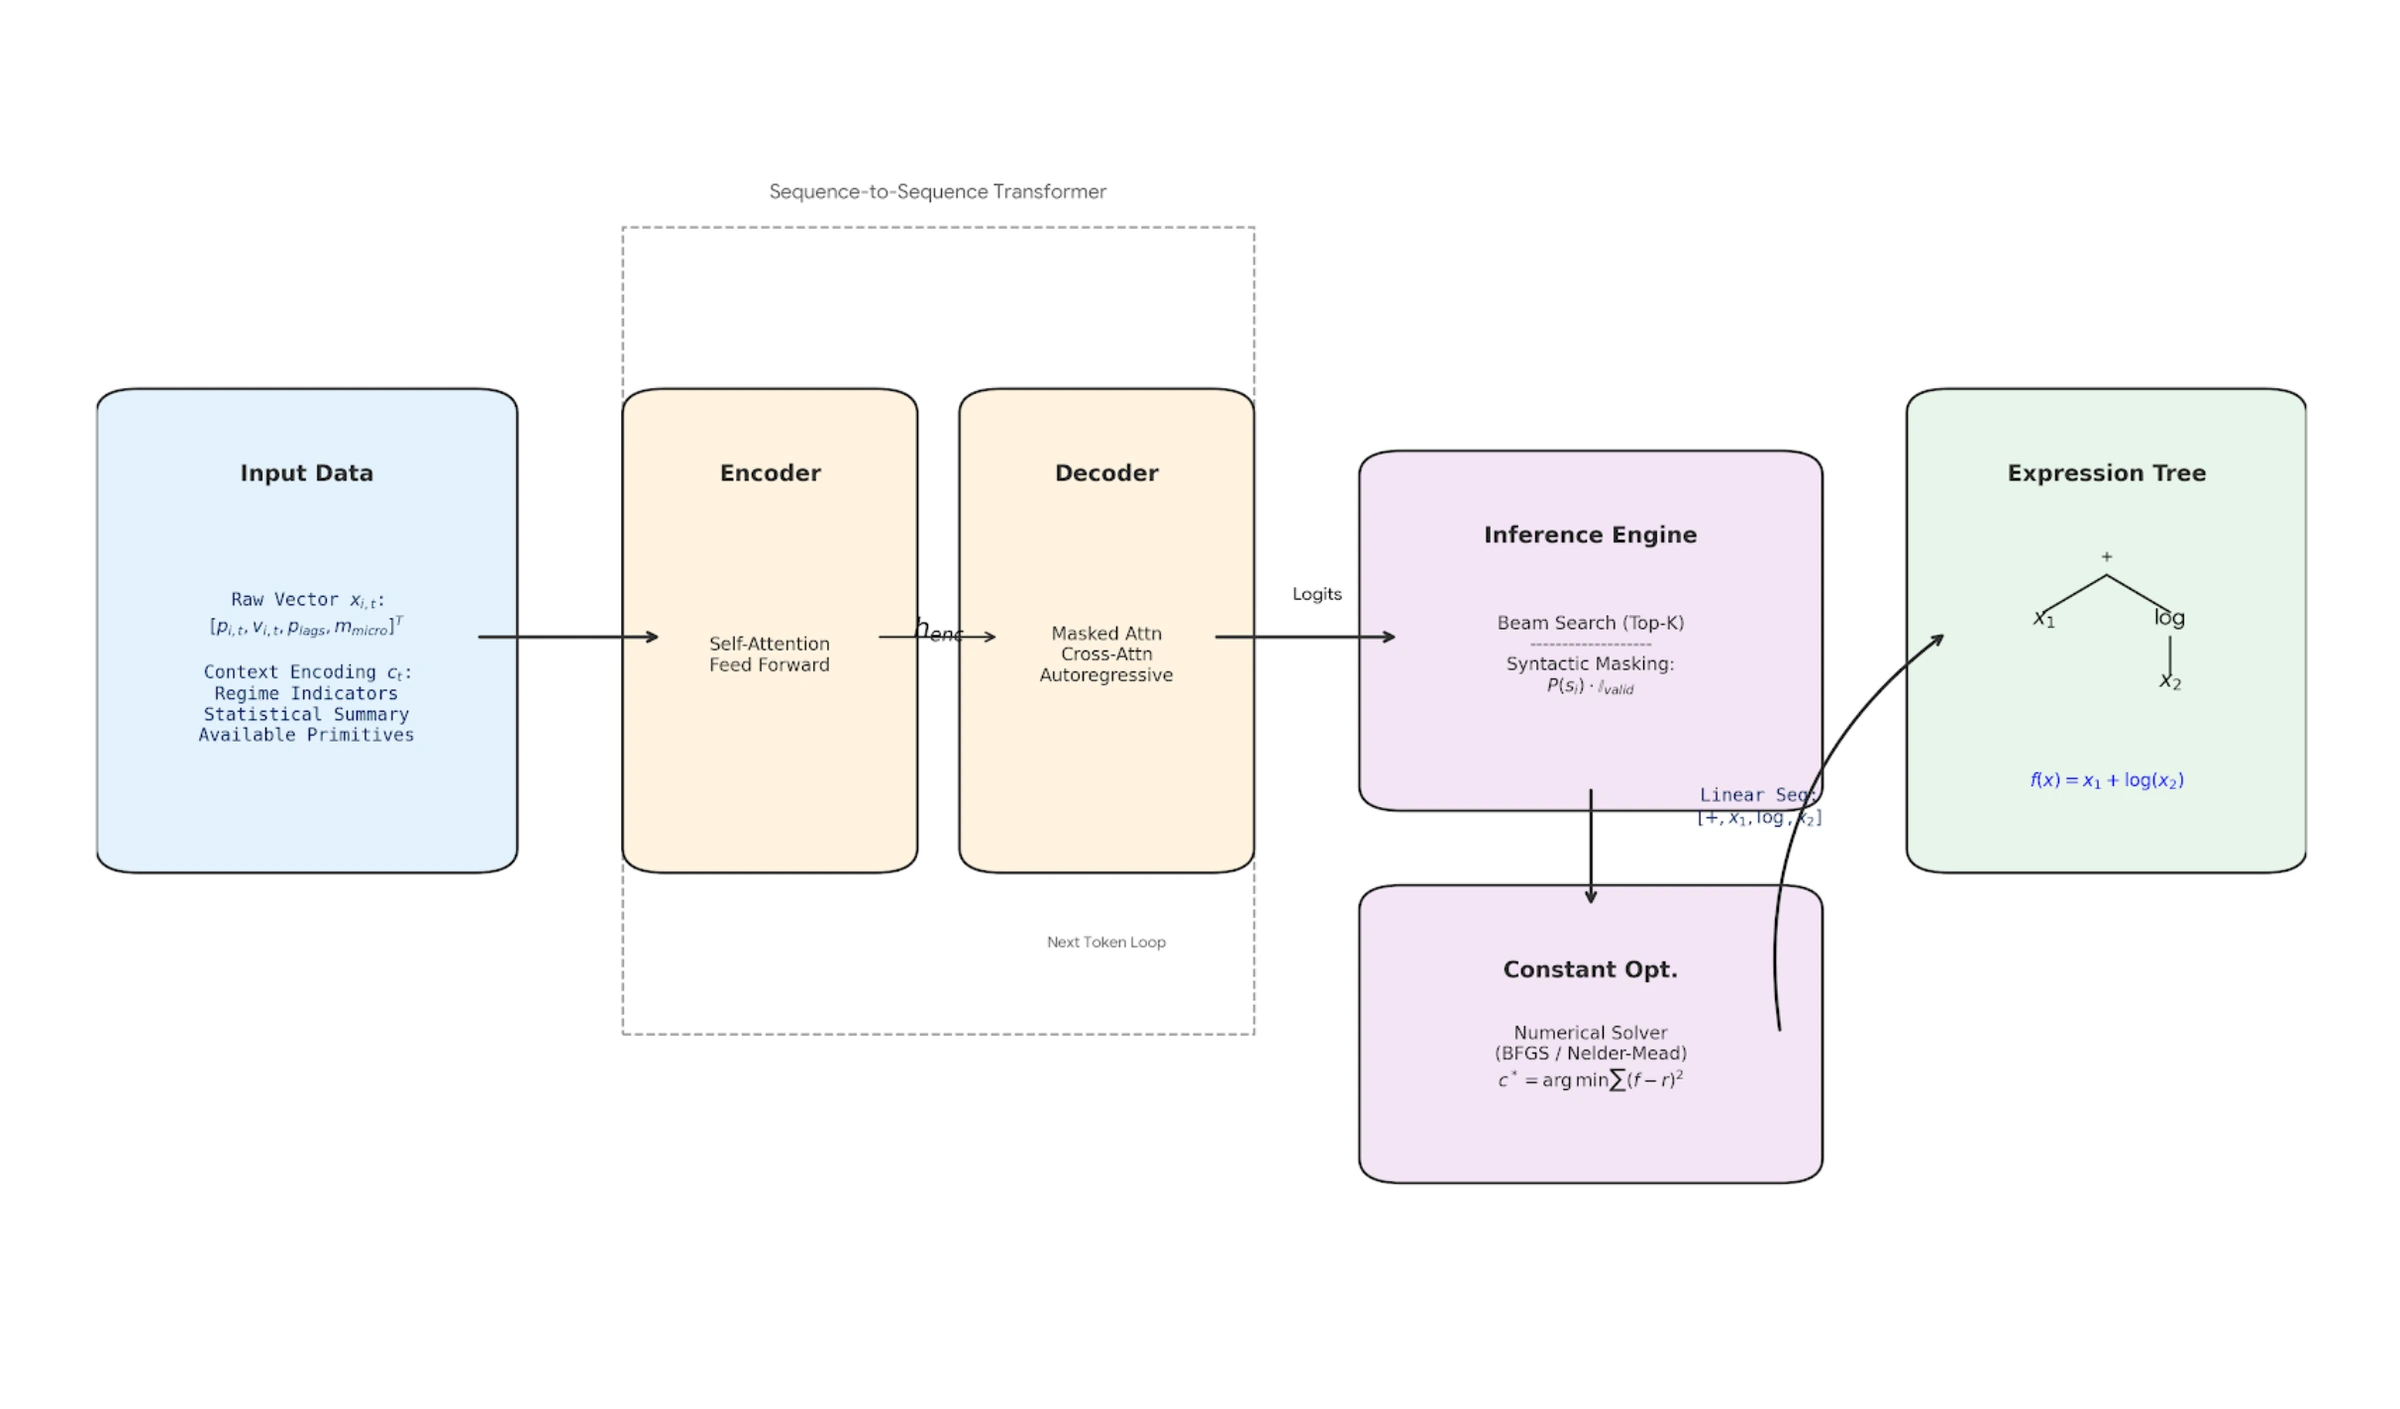
Figure 2 — Transformer-Based Symbolic Regression Architecture. The sequence-to-sequence transformer encodes input data and context, then autoregressively generates expression sequences with syntactic masking. The inference engine uses beam search (top-k) with validity constraints, followed by numerical constant optimization via BFGS/Nelder-Mead solvers.
Recent advances apply sequence-to-sequence models to symbolic regression, treating formula generation as a translation problem from data to expressions.
Sequence Representation.
An expression tree is linearized into a sequence using preorder traversal. For example, the expression (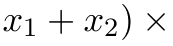 log(
log( ) becomes:

A vocabulary V consists of operators, variable tokens, and constant placeholders. The transformer model learns a distribution:

where s is the sequence and D represents the training data (input-output pairs).
Training Objective.
The model is trained on a corpus of expression-data pairs 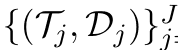
 by maximizing the log-likelihood:

where θ denotes transformer parameters. During inference, beam search generates candidate sequences, which are then evaluated on the target dataset.
Constant Optimization.
Generated sequences contain constant placeholders that must be optimized numerically. For a sequence s with constants  ), the optimization problem is:

This is solved using gradient-free methods such as BFGS or Nelder-Mead, as the function  may not be differentiable with respect to c due to discrete operators.
3.4 Computational Complexity Analysis
The computational cost of genetic programming scales with population size M, number of generations G, and fitness evaluation cost per individual. For a population evolved over G generations with crossover rate  and mutation rate
  :
:

Fitness evaluation dominates, requiring 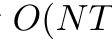 ) operations for IC computation over N assets and T time periods. Hierarchical search reduces G by warm-starting, while quality-diversity maintains larger effective populations.
Transformer-based symbolic regression has training cost 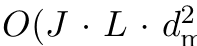 model) for J training examples and sequence length L, but inference is rapid:
 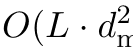 model) per generated sequence. This amortizes the training cost across multiple inference calls, offering orders-of-magnitude speedup for repeated feature generation tasks.
4 Deep Reinforcement Learning for Adaptive Feature Construction
Deep reinforcement learning frameworks conceptualize feature construction as a sequential decision process, wherein agents learn policies for generating, selecting, or weighting features through reward-based optimization. These approaches excel in capturing complex hierarchical patterns and adapting to nonstationary market dynamics.
4.1 Markov Decision Process Formulation
The feature construction problem is formulated as a Markov decision process (MDP) defined by the tuple (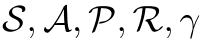 ) where S is the state space, A is the action space,
  ) is the transition function,
  is the reward function, and
 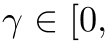 1) is the discount factor.
State Representation.
The state 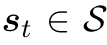 encodes information about the current feature construction context. For factor selection tasks, the state may include:
![s_t = [z_t^current, h_t^history, m_t^market]](/assets/feature-mining-eq-0123.png)
where ztcurrent represents currently selected features, hthistory encodes historical performance metrics, and mtmarket captures market regime indicators. For formulaic alpha generation, states st may encode partial expression trees or token sequences.
Action Space.
Actions 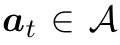 represent decisions in the feature construction process. In factor selection frameworks, actions specify which primitive features to include or exclude:

where binary actions indicate selection and continuous actions represent weights. For formulaic generation, actions may select operators and operands to extend partial expressions:

Reward Function Design.
The reward function 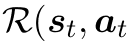 ) provides feedback on action quality. For factor construction, rewards are typically based on predictive performance:

where  denotes the feature constructed by action sequence
  . The complexity penalty encourages parsimony. Alternative reward formulations include the information ratio:

which directly aligns with economic objectives.
4.2 Hierarchical Reinforcement Learning
Hierarchical RL decomposes the feature construction task into multiple levels of abstraction, enabling more efficient exploration and better handling of long-horizon dependencies.
Two-Level Policy Architecture.
Consider a two-level hierarchy with a high-level policy  and low-level policy
  . The high-level policy selects abstract goals or subgoals
  :
:

The low-level policy executes primitive actions to achieve the specified goal:

For feature construction, high-level goals may specify which types of features to construct (e.g., momentum-based, mean-reversion, volatility), while low-level actions determine specific formulas or weights.
Hierarchical Value Functions.
Each level maintains its own value function. The high-level value function estimates expected return under high-level policy:

The low-level value function conditions on the goal:

where  is the time until goal completion and
 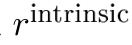 is an intrinsic reward for goal achievement.
Proximal Policy Optimization for Hierarchical Systems.
Both levels can be optimized using proximal policy optimization (PPO). The PPO objective for the high-level policy is:

high( ) is the probability ratio and ˆ
 where
where  is the t advantage estimate. The clipping ensures stable updates by limiting policy changes.
4.3 Transfer Learning and Regime Adaptation
Financial markets exhibit regime shifts that degrade performance of fixed feature construction policies. Transfer learning enables adaptation to new regimes with minimal additional training.
Pre-training on Historical Data.
A policy is first pre-trained on a large corpus of historical data spanning multiple market conditions:

This pre-trained policy  ) captures general feature construction principles applicable across diverse conditions.
Fine-tuning for Recent Regimes.
When deploying in a new regime characterized by recent data 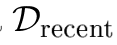 , the policy is fine-tuned:

The regularization term 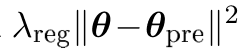 prevents catastrophic forgetting of general knowledge while adapting to regime-specific patterns.
Option Transfer.
In hierarchical RL, learned options (temporally extended actions) can be transferred across regimes. An option  ) consists of a policy
  , termination condition
  , and initiation set
  . Options learned in one regime (e.g., "construct momentum factor") may generalize to others if the underlying market mechanics persist.
The option library Ω= 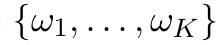 is maintained across regimes, and the high-level policy selects from this library:

New regimes may require learning new options, which are added to Ω for future use.
4.4 Variance Reduction in Policy Gradients
Financial environments often exhibit low stochasticity in rewards, making standard policy gradient methods inefficient. Specialized variance reduction techniques are essential.
Tailored Baseline Functions.
The policy gradient estimator is:

where 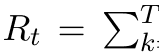
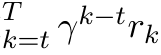 is the return and
  is a baseline. Standard baselines use state value functions
 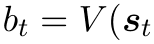 ), but for low-variance environments, more sophisticated baselines are beneficial.
A tailored baseline incorporates domain knowledge:

where  is a reference policy (e.g., simple heuristic) and η controls the contribution. This reduces variance by accounting for the baseline performance achievable without learning.
Reward Shaping for Steady Alphas.
Raw IC or Sharpe rewards can be volatile, leading to high-variance gradients. Reward shaping transforms rewards to reduce variance while preserving optimal policies. Define shaped reward:

where Φ:  is a potential function. For feature construction, Φ can encode preferences for steady performance:

penalizing high IC variance. This encourages policies that generate stable factors.
4.5 Joint Representation and Policy Learning
Traditional RL applies policies to fixed state representations. Joint learning optimizes both the representation and policy simultaneously, enabling feature-aware state encodings.
The system consists of an encoder network 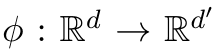 mapping raw features to learned representations, and a policy network
 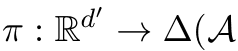 ):
):

Training Objective.
The joint objective combines supervised representation learning with RL optimization:

The supervised component  ensures representations retain predictive information:

This multi-task learning prevents the encoder from discarding information useful for prediction while optimizing for RL objectives.
4.6 Computational Considerations
Training deep RL policies is computationally intensive. For a policy network with m parameters trained over  iterations with batch size B:

Environment interaction cost Costenv includes computing rewards (backtesting), which dominates. Forward and backward passes through the network scale as  ). Hierarchical architec-tures reduce
  through temporal abstraction, while transfer learning amortizes training cost across regimes.
5 Large Language Model-Based Feature Generation
Large language models offer a novel paradigm for automated feature construction, leveraging pre-trained knowledge to rapidly generate candidate formulas through natural language prompting and iterative refinement. These systems combine generation speed with the ability to provide natural language rationales.
5.1 Prompting Framework for Alpha Generation
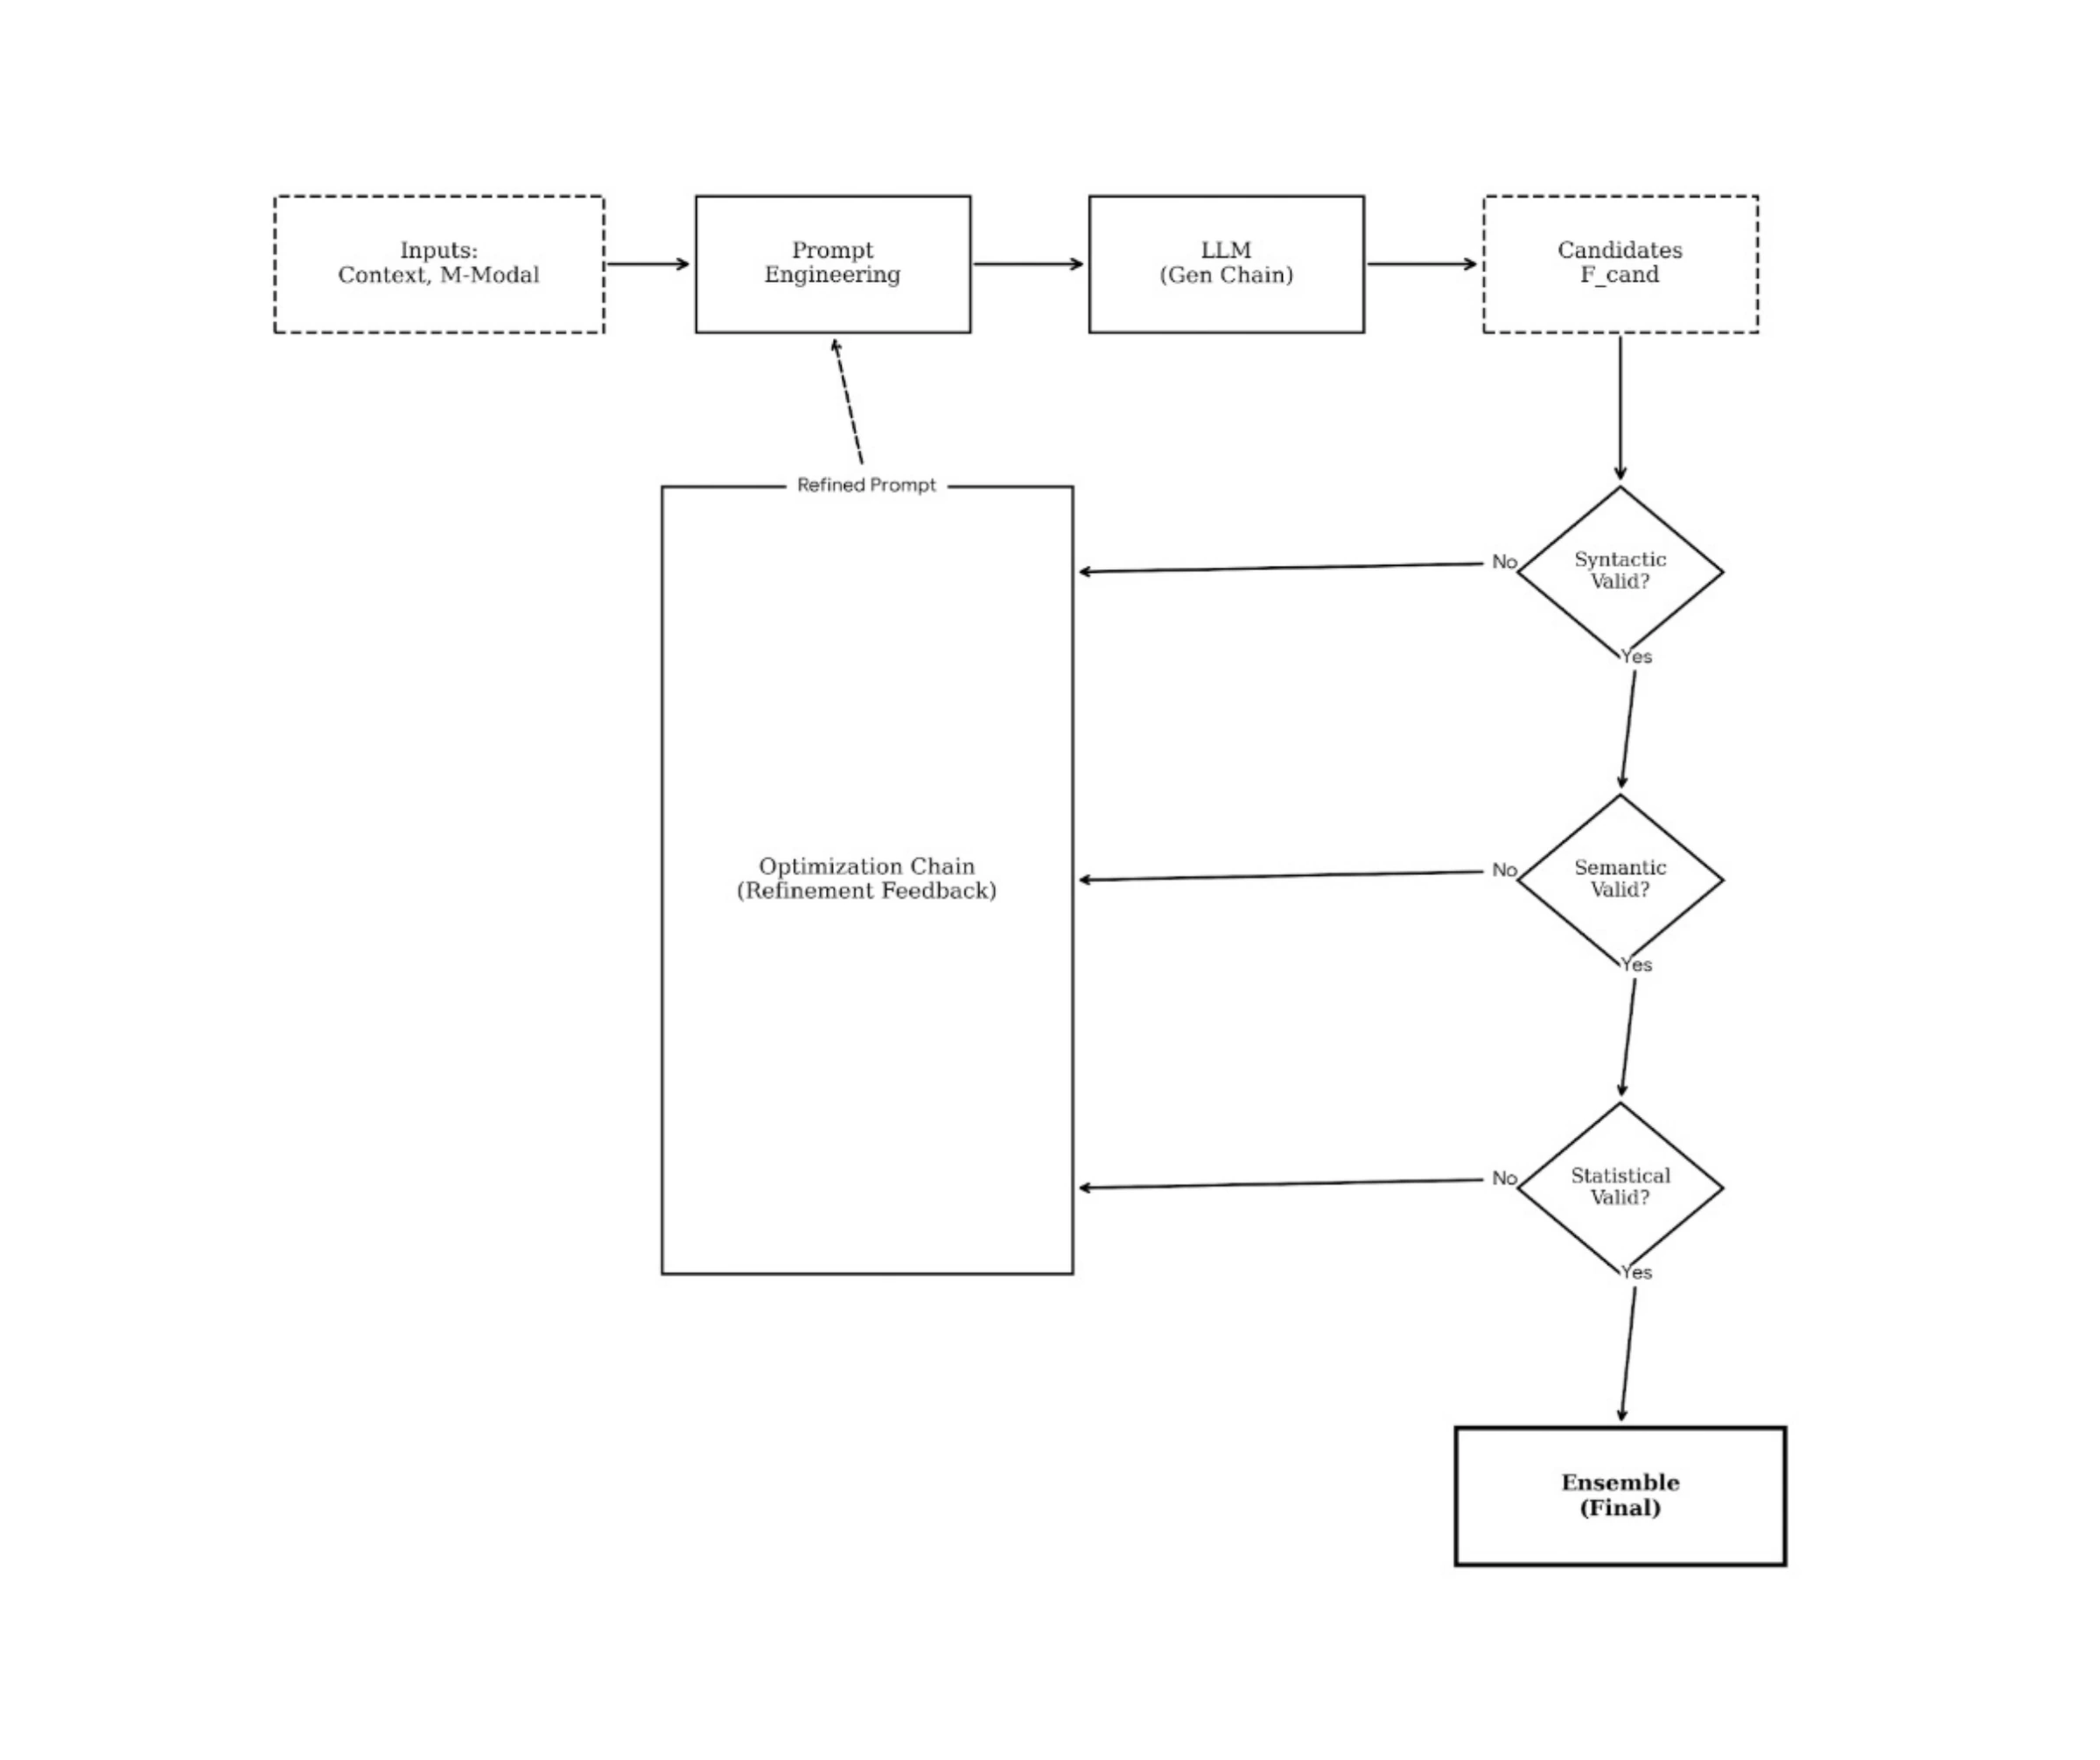
Figure 3 — LLM-Based Feature Generation with Multi-Stage Validation. The system employs prompt engineering to generate candidate formulas (F_cand) from context and multimodal inputs. Generated candidates undergo three-stage validation (syntactic, semantic, statistical) with iterative refinement through an optimization chain. Valid candidates are assembled into a final ensemble.
LLM-based feature construction systems employ structured prompting to guide generation toward economically meaningful and syntactically valid formulas.
Prompt Structure.
A prompt P consists of context, instructions, and constraints:

The context 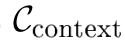 provides market information, available features, and domain knowledge. The instruction
 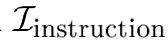 specifies the generation task (e.g., "Generate a formulaic alpha factor for momentum trading"). Constraints
  enforce requirements (e.g., "Use only price and volume data", "Maintain linear complexity").
Generation Process.
Given prompt P, the LLM generates a sequence s representing a candidate formula:

where  denotes the pre-trained model parameters. The sequence is parsed into an executable formula
  . Multiple candidates are generated through sampling with temperature τ:

Higher temperature increases diversity at the cost of potential syntactic errors.
5.2 Iterative Refinement with Dual Chains
A key innovation in LLM-based systems is iterative refinement through dual optimization chains that generate and improve candidates based on performance feedback.
Generation Chain.
The generation chain produces initial candidates:

Each candidate is evaluated on historical data to compute performance metrics  )
) . i i Optimization Chain.
The optimization chain refines candidates based on evaluation results. A new prompt  opt incorporates performance feedback:

where  denotes prompt concatenation and Feedback constructs a natural language description of performance characteristics. The LLM generates refined candidates:

This process iterates for M rounds, progressively improving candidate quality.
Convergence Analysis.
Let  = maxK
  Quality(
 ) denote the best quality at iteration m. Under assump-i tions of monotonic improvement in prompt quality and bounded LLM generation variance, the sequence
 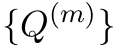 exhibits convergence properties:

where  is the optimal achievable quality and
  0 is the improvement rate. This implies exponential convergence to a neighborhood of
  .
.
5.3 Tree-Structured Thought Evolution
Standard prompting generates linear sequences, which may be suboptimal for hierarchical alpha formulas. Tree-structured thought evolution encodes hierarchical reasoning in prompts.
Hierarchical Prompt Templates.
A hierarchical prompt template 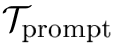 mirrors the structure of desired formulas:
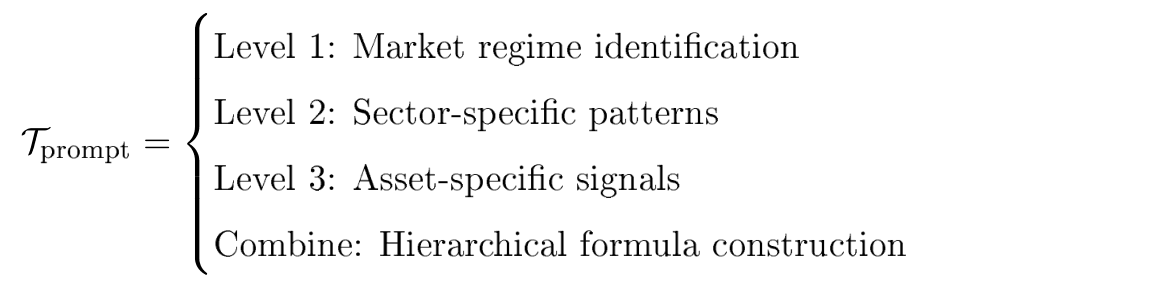
The LLM generates content for each level sequentially, with lower levels conditioned on higher-level outputs:

Evolutionary Operators on Thought Trees.
Thought trees 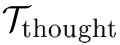 can be evolved using operators analogous to genetic programming:

Crossover( 1 where subtree at
  replaced by subtree at
  (60) These operations enable exploration of the hierarchical formula space while maintaining coherent structure.
5.4 Multimodal Feature Integration
LLMs can process multiple data modalities (text, images, numerical data) to generate features incorporating diverse information sources.
Multimodal Prompt Construction.
A multimodal prompt  includes:

where  is numerical market data,
  is textual information (news, reports), and
 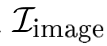 includes visualizations (charts, heatmaps). The LLM processes these through modality-specific encoders:

These representations are fused:

and used to condition generation:

Attention Mechanisms for Modality Weighting.
The fusion function employs attention to weight modalities based on relevance:

The fused representation is:

This allows the model to emphasize the most informative modality for each generation task.
5.5 Validation and Filtering
LLM-generated formulas require rigorous validation to filter hallucinated or economically spurious patterns.
Syntactic Validation.
Generated sequences must be parseable into valid expressions. A parser  attempts to construct a syntax tree:

If parsing fails, the candidate is rejected. Syntactic validation checks include:

Semantic Validation.
Semantic validation assesses economic plausibility. Heuristic checks include:

where Constant(f) checks if f produces constant output, Unbounded(f) detects numerical instabilities, and Monotonic(f) verifies reasonable behavior.
Statistical Validation.
Candidates passing syntactic and semantic checks undergo statistical validation through backtesting:

where thresholds  and
and  are specified based on deployment requirements.
5.6 Ensemble Construction
Multiple validated candidates are combined into an ensemble to improve robustness and reduce single-factor risk.
Static Weighting.
Simple ensemble approaches assign fixed weights based on validation performance:

Weights are normalized: 
 = 1.
= 1.
Dynamic Gating.
More sophisticated ensembles employ dynamic gating based on market context:

where 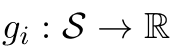 is a learned gating function that assigns weights based on current market state
  . The gating functions are trained to maximize ensemble performance:

5.7 Computational Efficiency
LLM-based generation is computationally efficient compared to evolutionary or RL approaches. For a pre-trained model with P parameters generating K candidates of length L:

The generation cost 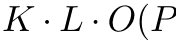 ) is typically much smaller than evaluation cost
  Costeval. Moreover, generation can be parallelized across candidates, and pretraining amortizes model training cost. The main computational burden lies in validating and backtesting generated candidates, which is unavoidable across all methodologies.
6 Comprehensive Evaluation Framework
Rigorous evaluation of automatically generated features requires multifaceted assessment encompassing statistical validation, economic performance, robustness testing, and overfitting detection. This section establishes a systematic framework for validation.
6.1 Statistical Validation Metrics
Information Coefficient Analysis.
The information coefficient measures the cross-sectional correlation between factor values and forward returns. For factor f evaluated at time t across N assets:

The Pearson correlation assumes linear relationships, while Spearman rank correlation (Rank IC) is more robust to outliers:

Time-series statistics of IC provide comprehensive characterization:
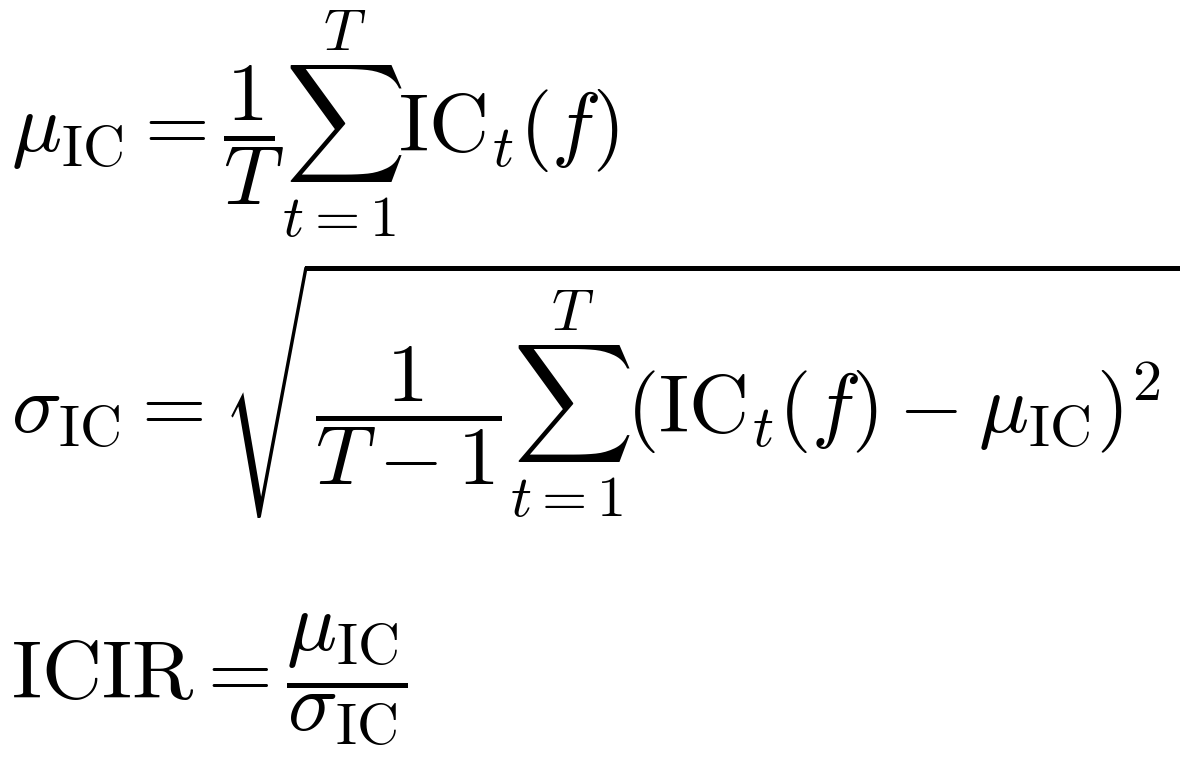
Higher ICIR indicates both strong predictive power and temporal stability.
Statistical Significance Testing.
The null hypothesis  = 0 is tested using the t-statistic:
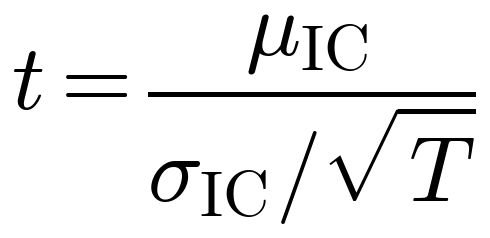
Under  follows a Student's t-distribution with
  1 degrees of freedom. The p-value is:

Factors with p-value  05 are considered statistically significant. However, multiple testing correction is essential when evaluating many candidates. The Bonferroni correction adjusts the significance threshold to
  for K tests.
6.2 Economic Performance Assessment
Portfolio Construction.
A long-short portfolio is constructed by ranking assets according to factor values. At time t, assets are partitioned into quantiles 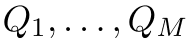 based on
  ). The portfolio goes long the top quantile and short the bottom:
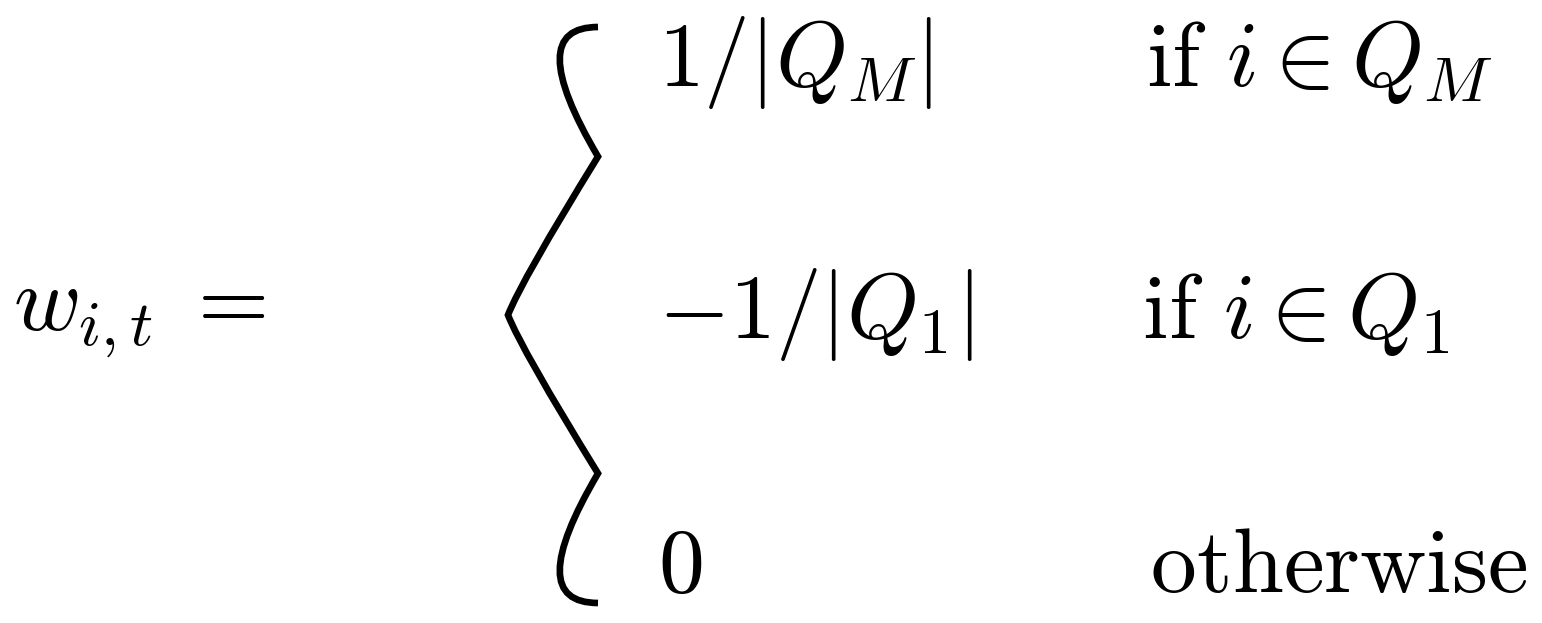
The portfolio return is:
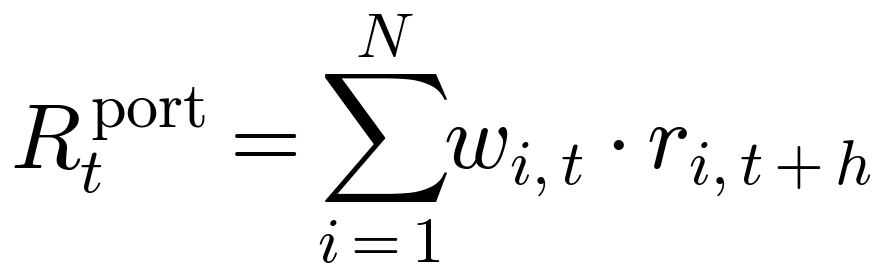
Sharpe Ratio.
The Sharpe ratio measures risk-adjusted returns:
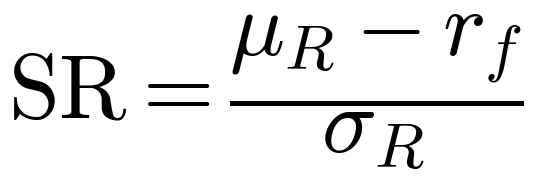
where ![mu_R = E[R_t^port], sigma_R = sqrt(Var[R_t^port])](/assets/feature-mining-m-0244b.png) are the mean and standard deviation of portfolio returns, and rf is the risk-free rate. The annualized Sharpe ratio for daily returns is:
are the mean and standard deviation of portfolio returns, and rf is the risk-free rate. The annualized Sharpe ratio for daily returns is:

Maximum Drawdown.
Maximum drawdown quantifies downside risk:

where Ct = ∏k=1t(1 + Rkport) is the cumulative wealth. Lower MDD indicates better risk management.
Transaction Cost Adjustment.
Realistic performance assessment requires accounting for transaction costs. The turnover at time t is:

With proportional transaction cost c, the net return is:

All performance metrics should be computed using  t.
t.
6.3 Out-of-Sample Validation
Train-Validation-Test Split.
The dataset is partitioned into nonoverlapping periods:

Feature construction is performed on  , hyperparameters are selected using
  , and final performance is reported on
  . Typical splits are 60%-20%-20%.
Walk-Forward Analysis.
Walk-forward analysis simulates realistic deployment by repeatedly training on expanding windows and testing on subsequent periods. For window size W and step size S:

Performance is averaged across all folds  :
:

6.4 Robustness Testing
Regime-Specific Analysis.
Market regimes are identified using regime-switching models or heuristic rules (e.g., bull/bear/sideways based on moving averages). Performance is evaluated separately in each regime  :
:

Factors exhibiting consistent performance across regimes are more robust.
Crisis Period Testing.
Historical crisis periods (e.g., 2008 financial crisis, 2020 COVID crash) provide stress tests. Define crisis indicator:

Performance during crises is:

Cross-Market Validation.
Factors are tested on multiple markets (e.g., US, Europe, Asia) to assess generalization. Let  denote different markets. Performance variance across markets:

Low variance indicates robust cross-market performance.
6.5 Overfitting Detection
In-Sample vs Out-of-Sample Performance Gap.
The performance gap between training and test sets indicates overfitting:

Large positive ∆overfit suggests overfitting. A threshold ∆overfit  triggers rejection.
Permutation Testing.
Permutation testing assesses whether observed performance could arise by chance. The null Generate B permutations by hypothesis is that factor values and returns are independent. randomly shuffling returns:

where  is a random permutation. Compute performance on each permutation:

The empirical p-value is:

Data Snooping Bias.
Testing multiple factors on the same dataset introduces data snooping bias. The probability of finding at least one significant factor by chance when testing K independent factors is:

For K = 100 and 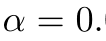 05, this probability is approximately 0.994. The Bonferroni correction or False Discovery Rate (FDR) control mitigates this:

The Benjamini-Hochberg procedure controls FDR at level q by rejecting hypotheses with p-values below:

when p-values are sorted in ascending order.
6.6 Factor Decay Analysis
Factor performance often degrades over time due to crowding or regime shifts. Decay analysis tracks performance as a function of time since discovery.
Rolling Window Performance.
Compute performance in rolling windows of length W:

A decreasing trend in Perfroll(t) indicates decay.
Half-Life Estimation.
The half-life  is the time for performance to decay to half its initial value. Fit an exponential decay model:

The half-life is:

Factors with longer half-lives are more durable.
6.7 Comprehensive Evaluation Scorecard
A comprehensive evaluation combines multiple metrics into a scorecard. Define weighted score:

where metrics include IC, Sharpe, MDD, p-value, OOS performance gap, and regime consistency. Weights  reflect deployment priorities. Factors exceeding a threshold score are selected for deployment.
7 Proposed Hybrid Architecture: Transformer-RL Feature Constructor
We propose a novel hybrid architecture that integrates transformer-based symbolic generation with reinforcement learning refinement, combining interpretability with adaptive capability. This system, termed Transformer-RL Feature Constructor (TRFC), employs a two-stage process: initial generation of candidate formulas through sequence-to-sequence modeling, followed by policy-based refinement optimizing for economic performance metrics.
7.1 Architecture Overview
The TRFC system consists of three primary components: a transformer-based generator G, a reinforcement learning refiner R, and an evaluation module E. The workflow proceeds as follows:

This architecture leverages the rapid generation capability of transformers while incorporating the adaptive refinement of reinforcement learning. Figure 4 illustrates the complete system architecture, showing the two-stage process and feedback loop.
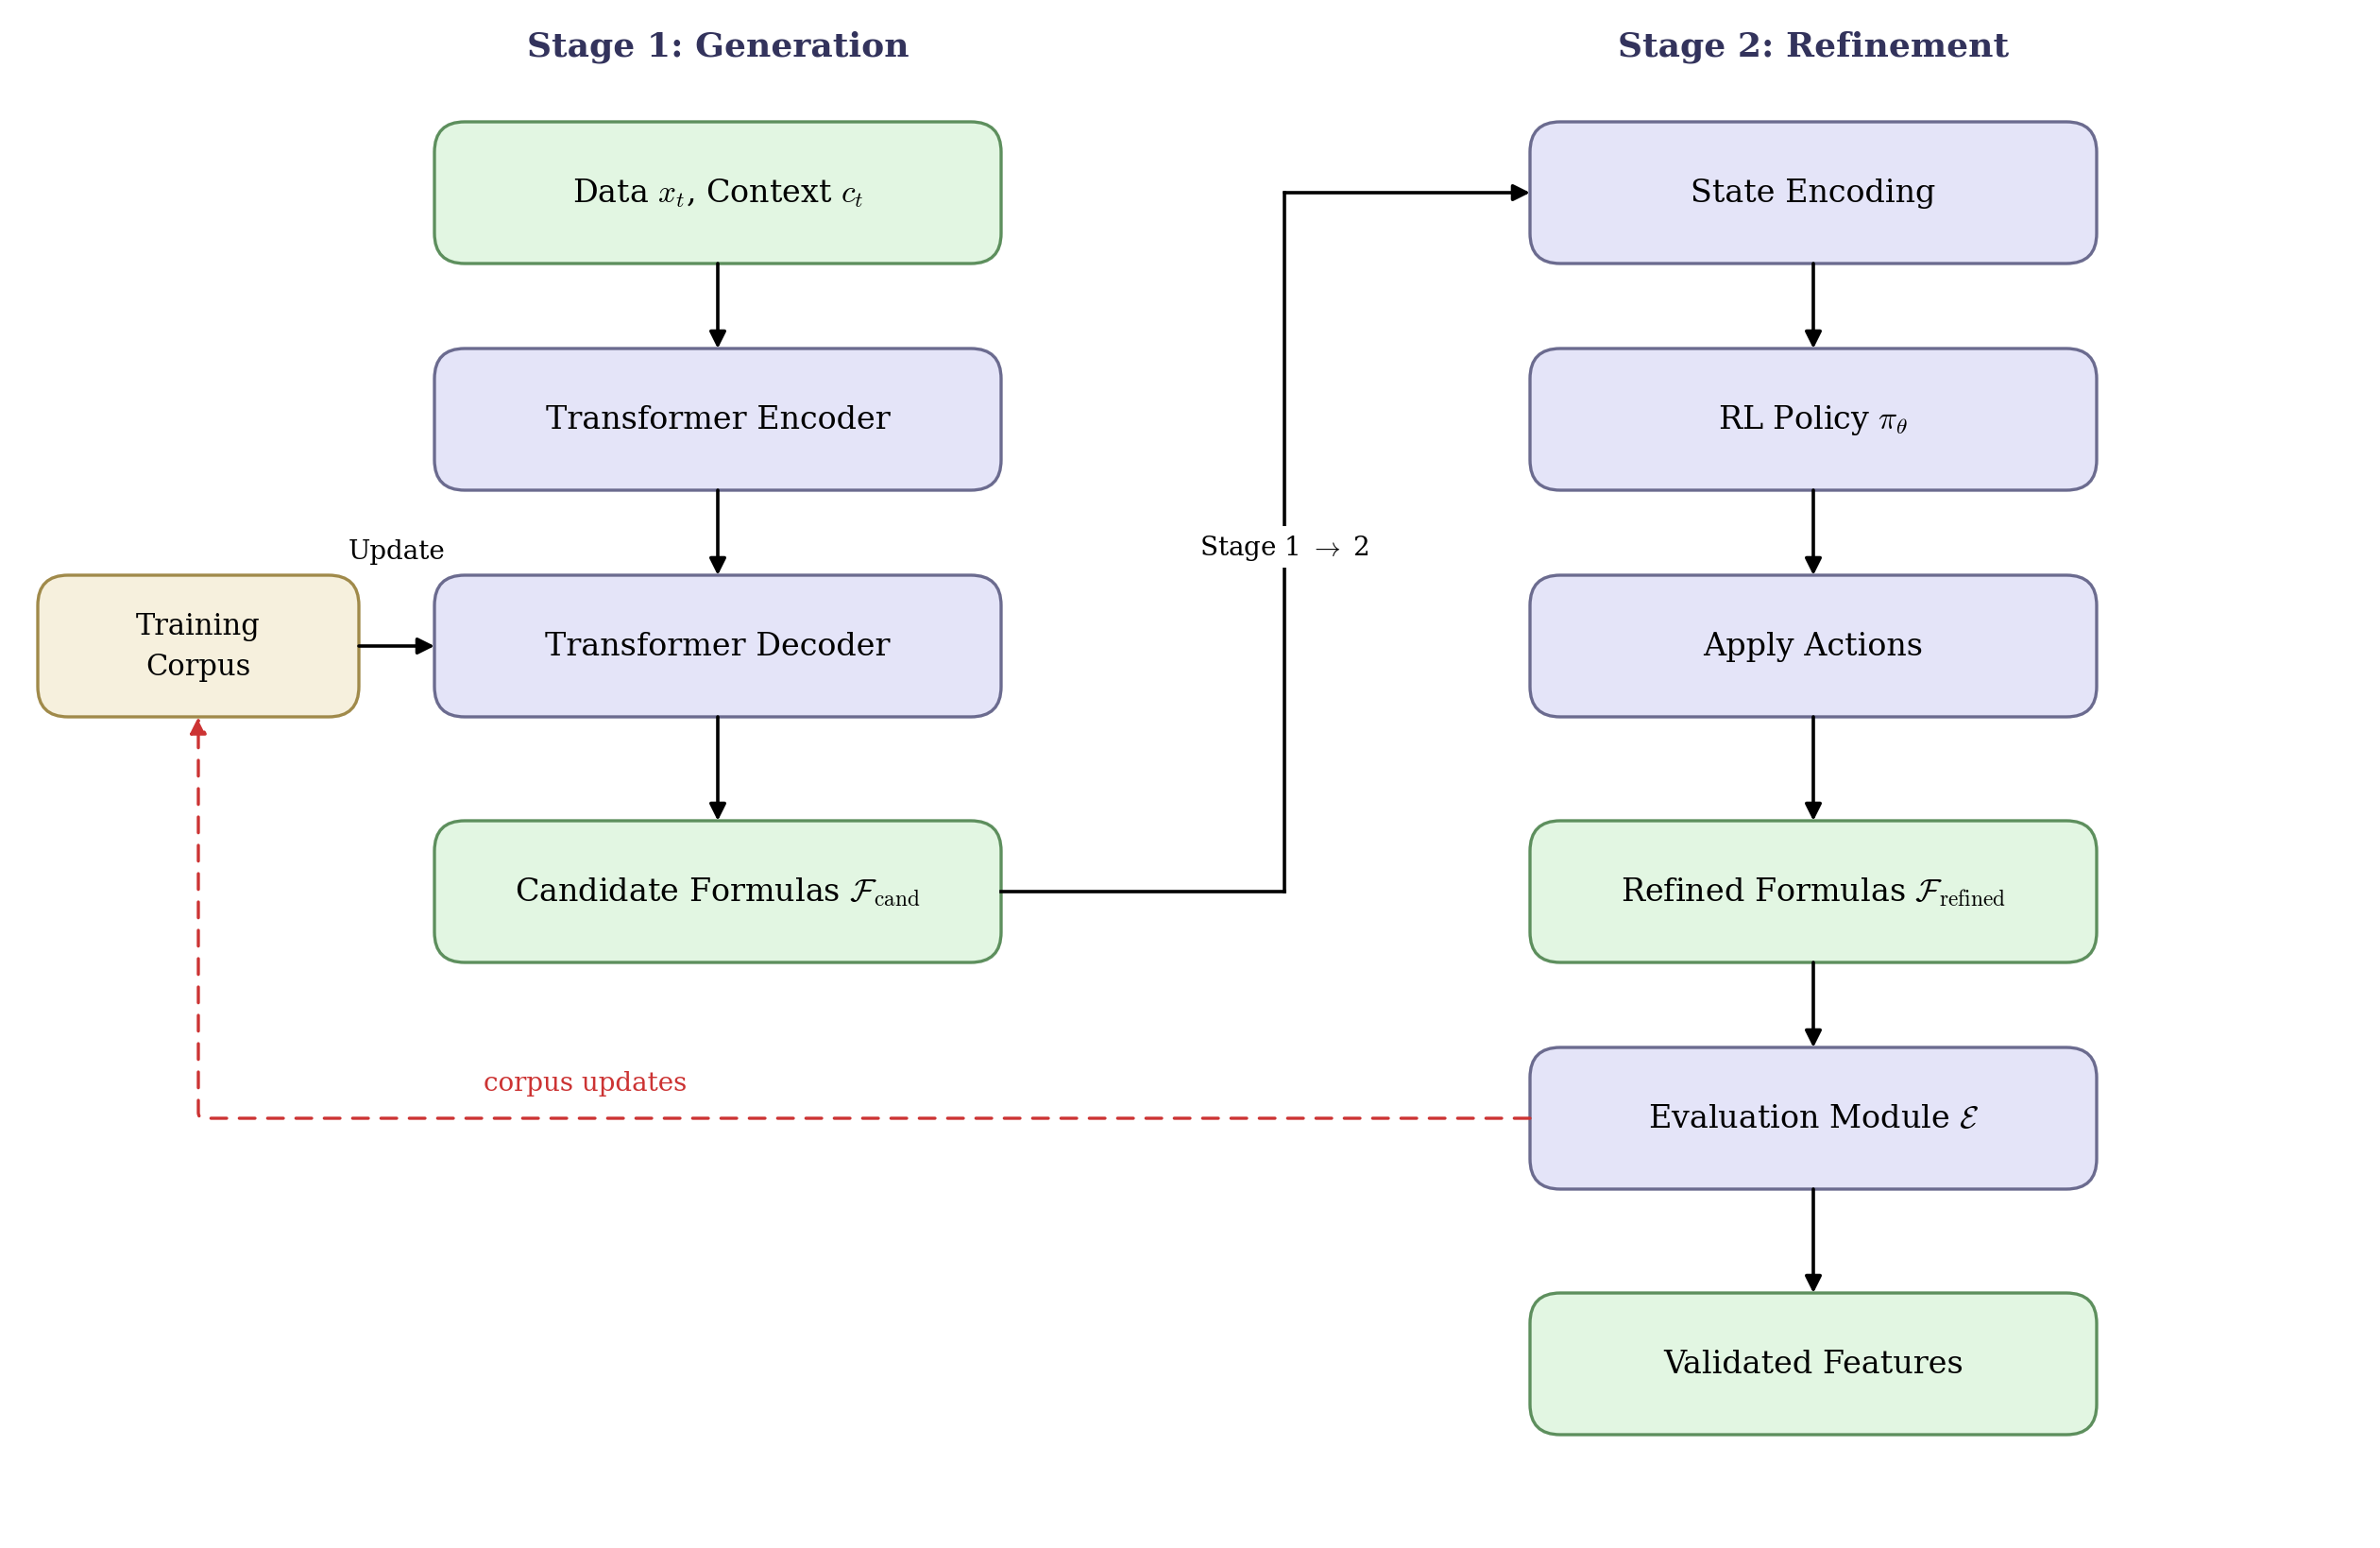
Figure 4 — TRFC Architecture: Two-stage system combining transformer-based generation with RL refinement. The feedback loop enables continuous improvement through performance-driven corpus updates.
7.2 Stage 1: Transformer-Based Generation
Sequence-to-Sequence Architecture.
The generator employs a transformer encoder-decoder architecture. The encoder processes market context  :
:

where  includes statistical summaries of recent market data, regime indicators, and available primitive features. The decoder generates formula sequences autoregressively:

Training Data Construction.
The transformer is pre-trained on a corpus of formula-performance pairs. For each historical period  , we compute performance of a library of known formulas
  :
:

The training objective combines sequence likelihood with performance-weighted sampling:

where  ) = exp(
 ) emphasizes high-performing formulas.
Beam Search with Constraints.
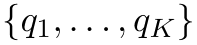
During inference, beam search generates diverse candidates while enforcing syntactic validity. The beam maintains K partial sequences 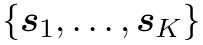 with scores
  :
:

At each step, the beam is expanded and pruned to maintain the top-K sequences. Syntactic constraints are enforced by masking invalid tokens:

where 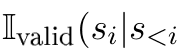 ) indicates whether token
  is syntactically valid given prefix
  .
.
7.3 Stage 2: Reinforcement Learning Refinement
State and Action Spaces.
The refinement stage formulates feature improvement as an MDP. The state  encodes the current formula and its performance characteristics:

Actions  represent local modifications to the formula:

Each action type has associated parameters (e.g., which operator to swap, where to add a node).
Policy Network.
The policy network  outputs a distribution over actions:

The MLP consists of multiple hidden layers with ReLU activations:

Reward Function Design.
The reward function balances multiple objectives:

where ∆ denotes change from previous formula. The complexity penalty discourages excessive elaboration:

An additional reward component encourages interpretability:

where EditDistance(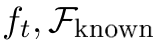 ) measures similarity to known, interpretable formulas.
Proximal Policy Optimization.
The policy is trained using PPO with clipped objective:

where  ) and advantage estimates ˆ
 are computed using Gen-eralized Advantage Estimation:

7.4 Integration and Iteration
Iterative Refinement Loop.
The system iterates between generation and refinement:
Input:  Transformer 𝒢, RL policy ℛ, evaluation module ℰ, epochs E
Output: Best features 𝓕_best

 1: Initialize transformer 𝒢 and RL policy ℛ
 2: for epoch = 1 to E do
 3:     Generate candidates: 𝓕_cand ← 𝒢(cₜ)
 4:     for each f ∈ 𝓕_cand do
 5:         f_refined ← ℛ(f)                              // Apply RL refinement
 6:         Evaluate: Score(f_refined) ← ℰ(f_refined)
 7:     end for
 8:     Update 𝓕_best with top performers
 9:     Fine-tune 𝒢 on 𝓕_best                            // Improve generation
10:     Update ℛ using PPO with collected trajectories
11: end for
12: return 𝓕_best
Feedback Mechanism. Performance feedback from refined formulas improves the generator. High-performing refined formulas are added to the training corpus:

The generator is periodically fine-tuned on the augmented dataset, creating a virtuous cycle of improvement.
7.5 Theoretical Properties
Convergence Guarantees. Under standard assumptions (bounded rewards, Lipschitz policy updates), the PPO component converges to a local optimum of the policy objective. The transformer generation quality improves monotonically with additional high-quality training examples, provided the examples are drawn from the same distribution. The combined system exhibits progressive improvement in expected performance: Let  denote the expected quality of features produced at epoch e. Under assumptions of monotonic improvement in both generator and refiner, and bounded approximation error:

where  is optimal achievable quality,
  0 is improvement rate, and ϵ is approximation error. Interpretability Preservation. The RL refinement is constrained to preserve interpretability through the reward structure. Define an interpretability measure
  ) based on formula complexity and similarity to known patterns. The refinement policy satisfies:

where ξ is a small tolerance. This ensures refined formulas remain interpretable.
7.6 Implementation Details
Transformer Specifications.
The transformer uses:
- Encoder: 6 layers, 8 attention heads, 512-dimensional embeddings
- Decoder: 6 layers, 8 attention heads, 512-dimensional embeddings
- Vocabulary: 200 tokens (operators, variables, constants)
- Position encoding: sinusoidal
- Dropout: 0.1 Training employs AdamW optimizer with learning rate 10
 , warmup for 4000 steps, and cosine decay. RL Policy Specifications. The policy network consists of:
 - Input: 256-dimensional state embedding
- Hidden layers: [512, 512, 256] with ReLU activations
- Output: Action logits (dimension depends on action space)
- Value network: Shared encoder with separate output head PPO hyperparameters:
 95, batch size 256, 10 PPO epochs per update. Computational Requirements. Training the transformer requires approximately 100 GPU-hours on a modern GPU (e.g., NVIDIA A100). The RL refinement adds 50-100 GPU-hours depending on the number of refinement steps. Inference is efficient: generating and refining 100 candidates takes approximately 10 minutes on a single GPU.
7.7 Advantages of Hybrid Approach
The TRFC architecture achieves several desirable properties:
Interpretability: Formulas remain explicit mathematical expressions, enabling domain expert validation and economic interpretation.
Efficiency: Transformer generation is orders of magnitude faster than evolutionary search, while RL refinement is more sample-efficient than training from scratch.
Adaptability: The RL component enables online adaptation to regime shifts through continuous fine-tuning on recent data.
Quality: The two-stage process combines the broad exploration of transformers with the focused optimization of RL, achieving higher quality than either approach alone.
Robustness: Diversity in transformer generation and regularization in RL training reduce overfitting risk.
The hybrid architecture addresses limitations of individual approaches while leveraging their complementary strengths, providing a robust foundation for automated feature construction in production environments.
8 Empirical Analysis and Comparative Assessment
This section synthesizes empirical evidence from recent literature to characterize performance profiles across methodologies, documenting reported results, computational requirements, and deployment characteristics.
8.1 Performance Synthesis
8.1.1 Symbolic Systems
Empirical studies of symbolic systems report substantial performance improvements over baseline methods. Strongly typed genetic programming combining technical and sentiment analysis achieved median return improvements up to a factor of two compared to standard GP variants and machine learning baselines when tested on 35 stocks1. The hierarchical evolutionary algorithm AutoAlpha demonstrated effective alpha discovery with robust backtest performance in Chinese A-share markets2. The most striking result comes from transformer-based symbolic regression (IRFT), which reported approximately 30% excess investment return in high-frequency trading risk-factor mining on HS300 and S&P 500 benchmarks compared to symbolic regression baselines3. This system achieved orders-of-magnitude faster inference compared to evolutionary methods, highlighting the efficiency gains from amortizing training costs. Classical genetic programming studies provide longer-term perspective, with early work demonstrating profitable single-day trading strategies4 and comparative analyses showing GP outperforming nine other machine learning algorithms on risk and Sharpe metrics across international datasets5.
8.1.2 Deep Reinforcement Learning
Hierarchical reinforcement learning approaches demonstrate strong performance with adaptive capabilities. The HPPO-TO system (Hierarchical PPO with Transferred Options) reported approximately 25% excess return in high-frequency trading markets across CSI300/800, Nifty100, and S&P 500 benchmarks6. This system employed transfer learning to pretrain on broad historical data before fine-tuning on recent periods, enabling adaptation to regime shifts. The QuantFactor REINFORCE approach, employing variance-bounded policy gradients, improved correlation with asset returns by approximately 3.83% and demonstrated stronger 1Christodoulaki et al., 2023 2Zhang et al., 2020 3Xu et al., 2024 4Kaboudan, 2000 5Long et al., 2025 6Xu et al., 2025 excess-return ability versus recent alpha-mining baselines7. The variance reduction techniques proved essential for stable learning in low-stochasticity financial environments. Joint feature-aware deep RL (TFJ-DRL) exhibited robust superiority across multiple price-trend regimes (rising, falling, sideways markets), highlighting the adaptability of learned feature representations8. Factor selection using deep RL showed substantial performance improvement for downstream forecasting models with forward predictive efficacy validated on holdout data9.
8.1.3 Large Language Model Approaches
Recent LLM-based systems (post-June 2024) report impressive results, though with important caveats regarding validation. AlphaQuant, employing GPT-4 for factor generation with ensemble selection, reported very high Sharpe ratios and returns in experimental setups, emphasizing rapid ideation capability10. However, specific quantitative values were not disclosed, and the experimental conditions require independent validation. Chain-of-Alpha, employing dual-chain iterative refinement (generation plus optimization chains), demonstrated strong empirical gains on Chinese A-share benchmarks11. The iterative loop systematically improved candidate quality across generations. Tree-structured thought evolution (TreEvo) improved alpha quality with reduced computational cost compared to standard prompting approaches by encoding hierarchical reasoning templates12. Event-aware sentiment factors derived from LLM-augmented social media analysis achieved statistically significant information coefficients in held-out tests with demonstrated tradability13. Multi-agent LLM frameworks generating diversified alphas from multimodal inputs showed improved stability and robustness compared to single-model baselines14.
8.2 Comparative Performance Metrics
| Method | Excess Return | IC Improvement | Market | Ref. |
|---|---|---|---|---|
| STGP (Symbolic) | 2× median | — | 35 stocks | [1] |
| AutoAlpha (Symbolic) | Strong | — | A-shares | [15] |
| IRFT (Symbolic) | ∼30% | — | HS300, S&P 500 | [10] |
| HPPO-TO (DRL) | ∼25% | Correlation | CSI300/800, Nifty, S&P | [2] |
| QuantFactor (DRL) | Strong | +3.83% | Various | [11] |
| TFJ-DRL (DRL) | Robust | — | Multiple regimes | [9] |
| AlphaQuant (LLM) | Very high | — | Not specified | [SSRN] |
| Chain-of-Alpha (LLM) | Strong | — | A-shares | [14] |
| Event Sentiment (LLM) | Significant IC | Significant | Held-out | [13] |
8.3 Computational Complexity Comparison
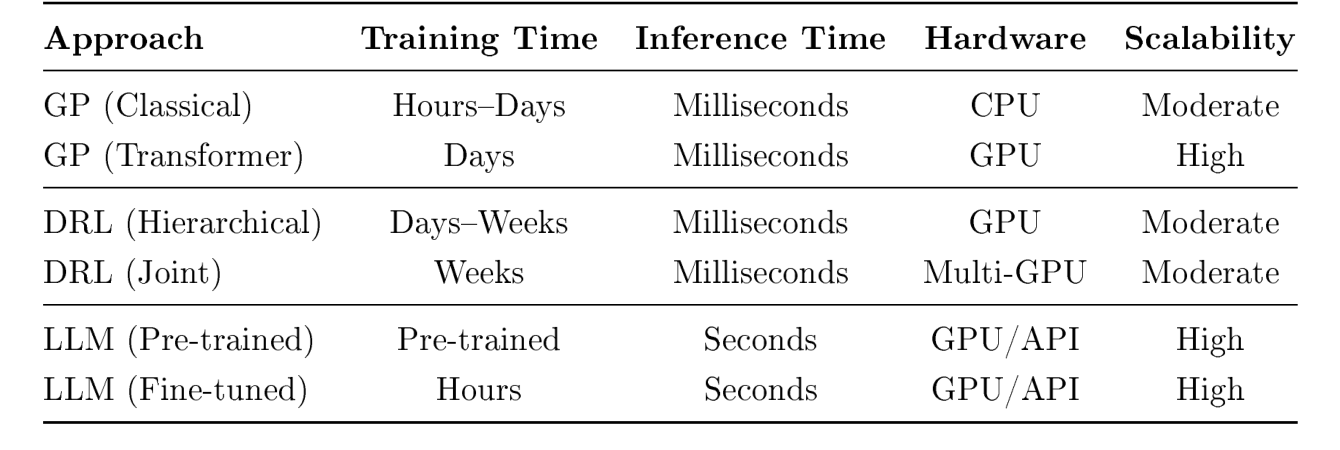
The computational landscape reveals distinct trade-offs. Symbolic systems using evolutionary algorithms require hours to days of CPU time for population evolution, but inference is extremely fast (milliseconds). Transformer-based symbolic regression shifts computation to an upfront training phase (days on GPU) but achieves rapid inference thereafter.
Deep RL systems demand substantial training resources (days to weeks on GPU) due to the need for extensive environment interaction and policy optimization. However, once trained, inference is fast. The hierarchical and transfer learning approaches reduce training time by leveraging pre-trained components.
LLM-based approaches benefit from pretraining, requiring only minutes to hours for prompt engineering and generation. Inference takes seconds per candidate due to autoregressive generation, but this is still orders of magnitude faster than evolutionary search. The main computational burden lies in backtesting and validation, which is unavoidable across all methodologies.
8.4 Interpretability and Explainability Assessment
Interpretability varies significantly across approaches. Symbolic systems produce explicit mathematical formulas that can be directly inspected, validated by domain experts, and subjected to stress testing. The formula structure reveals which raw features are used and how they are combined, facilitating economic interpretation.
Deep RL systems are largely black boxes. While the final feature construction policy can be executed, understanding why specific features are selected or weighted is challenging. Some interpretability can be recovered through attention visualization or saliency analysis, but these post-hoc methods provide limited insight compared to explicit formulas.
LLM-based approaches occupy a middle ground. Generated formulas are explicit and interpretable, similar to symbolic systems. Additionally, LLMs can provide natural language rationales explaining the economic intuition behind proposed features. However, the internal reasoning process of the LLM remains opaque, and rationales may not accurately reflect the true generation mechanism.
8.5 Adaptability and Robustness Analysis
Adaptability to regime shifts is critical for sustained performance. Symbolic systems produce static formulas that do not adapt online. However, hierarchical evolutionary algorithms with warm-starting can relatively quickly evolve new formulas when regimes change (hours to days).
Deep RL systems excel in adaptability. Hierarchical policies with transfer learning can rapidly fine-tune to new regimes (hours on GPU). The continuous learning capability enables online adaptation as new data arrives. However, this adaptability comes with risk of overfitting to recent noise.
LLM-based systems achieve rapid adaptation through regeneration. When performance degrades, new candidates can be generated in minutes and validated. The iterative refinement loops enable systematic improvement. However, each regime shift requires re-running the generation-validation cycle.
Robustness across markets varies. Symbolic systems trained on specific markets may not generalize well to others without re-evolution. Deep RL systems with transfer learning demonstrate better cross-market generalization. LLM systems leveraging pre-trained knowledge may generalize well if the pretraining corpus included diverse markets, though empirical validation is limited.
8.6 Overfitting Risk Assessment
All automated systems face overfitting risk, but the manifestations differ. Symbolic systems can overfit by discovering formulas that exploit historical idiosyncrasies. Diversity mechanisms (quality-diversity, PCA-guided selection) mitigate this but do not eliminate it. The large search space and numerous fitness evaluations increase overfitting risk.
Deep RL systems face overfitting through policy memorization of training episodes. Regularization techniques (entropy bonuses, weight decay) and validation-based early stopping are essential. The continuous parameter space and gradient-based optimization can lead to subtle overfitting that is difficult to detect.
LLM-based systems risk generating formulas that appear plausible but are economically spurious. The pretraining on public data may introduce data leakage if historical patterns were present in training corpora. Rigorous validation loops are critical. The rapid generation capability can lead to extensive data snooping if not carefully controlled.
Across all methodologies, out-of-sample validation, transaction cost adjustment, and multiple hypothesis testing correction are essential safeguards. The evaluation framework developed in Section 6 provides systematic procedures for overfitting detection.
8.7 Practical Deployment Considerations
Deployment readiness varies across approaches. Symbolic systems producing interpretable formulas are most suitable for regulated environments requiring explainability. The explicit formulas can be documented, stress-tested, and audited. However, the computational cost of evolution may limit responsiveness to market changes.
Deep RL systems are suitable for environments prioritizing adaptability over interpretability. The online learning capability enables continuous improvement, but regulatory approval may be challenging. The black-box nature requires robust monitoring infrastructure to detect degradation or unexpected behavior.
LLM-based systems offer rapid deployment for research and exploration. The generation speed enables quick iteration and experimentation. However, the validation burden is high, and regulatory acceptance uncertain. These systems are most appropriate for early-stage research and idea generation, with subsequent refinement using symbolic or RL methods for production deployment.
8.8 Synthesis and Objective Assessment
The empirical evidence reveals that multiple methodologies achieve substantial performance improvements over baseline approaches, with excess returns in the range of 20-30% reported across different studies. However, several important caveats apply:
Dataset Differences: Studies employ different markets, time periods, and asset universes, complicating direct comparison. Some results are on liquid large-cap stocks, others on broader universes including small-caps.
Transaction Costs: Many studies do not include realistic transaction costs, which can substantially reduce net returns, particularly for high-frequency strategies.
Out-of-Sample Rigor: The rigor of out-of-sample testing varies. Some studies employ walk-forward analysis with strict temporal separation, while others use simpler train-test splits that may be more susceptible to overfitting.
Publication Bias: Successful results are more likely to be published than null results, potentially inflating apparent performance.
Validation Requirements: Particularly for LLM-based approaches, extreme performance claims require independent validation before acceptance.
Despite these caveats, the consistent pattern of performance improvements across diverse methodologies, research groups, and markets suggests that automated feature construction offers genuine value. The choice of methodology should be guided by deployment requirements (interpretability, adaptability, computational budget) rather than solely by reported performance metrics.
9 Discussion
9.1 Fundamental Trade-offs
The analysis reveals fundamental trade-offs that constrain the design space of automated feature construction systems. These trade-offs are not artifacts of current technology but reflect inherent mathematical and computational constraints.
Interpretability vs Expressiveness.
Interpretable formulas constrain the hypothesis space to expressions constructible from primitive operations. This constraint limits expressiveness compared to arbitrary neural networks. For a symbolic space of depth D with  primitives, the expressible functions are a strict subset of all continuous functions on the input space. Deep neural networks with sufficient capacity can approximate any continuous function, but at the cost of interpretability.
This trade-off is fundamental: increasing expressiveness necessarily reduces interpretability. Symbolic systems prioritize interpretability, accepting limitations in capturing complex nonlinear patterns. Deep RL systems prioritize expressiveness, accepting black-box opacity. The proposed hybrid architecture attempts to balance these extremes by maintaining symbolic form while using RL for refinement within the symbolic space.
Computational Efficiency vs Search Quality.
Thorough exploration of large search spaces requires extensive computation. Evolutionary algorithms evaluating millions of candidates achieve comprehensive search but demand substantial resources. Gradient-based methods are computationally efficient but may converge to local optima. LLM generation is rapid but may miss regions of the space not well-represented in pretraining.
The computational-quality trade-off manifests in the choice between population-based methods (broad search, high cost) and gradient-based methods (focused search, lower cost). Hierarchical approaches and transfer learning partially mitigate this trade-off by amortizing computational cost across multiple tasks or time periods.
Adaptability vs Stability.
Systems capable of rapid adaptation to regime changes risk overfitting to transient noise. Static formulas are stable but fail to capture evolving patterns. This trade-off is particularly acute in financial markets where genuine regime shifts coexist with temporary fluctuations.
Regularization techniques (complexity penalties, diversity maintenance, validation-based early stopping) provide partial solutions but do not eliminate the fundamental tension. The optimal balance depends on the persistence of patterns: in markets with stable long-term relationships, stability is preferred; in rapidly evolving markets, adaptability is essential.
9.2 Limitations and Challenges
Nonstationarity and Regime Shifts.
Financial markets exhibit nonstationarity that degrades performance of fixed feature construction policies. While transfer learning and online adaptation provide mechanisms for handling regime shifts, fundamental challenges remain. Distinguishing genuine regime changes from temporary fluctuations requires sophisticated statistical methods and domain expertise.
The assumption underlying most automated systems—that patterns discovered in historical data will persist into the future—is inherently fragile. Market efficiency theory suggests that widely known patterns should be arbitraged away, creating a moving target for automated discovery systems. This necessitates continuous monitoring and periodic regeneration of features.
Data Requirements.
All methodologies require substantial historical data for training and validation. Evolutionary algorithms need sufficient data to evaluate fitness across diverse market conditions. Deep RL systems require extensive environment interaction. LLM pretraining demands large corpora. For assets with limited history or newly listed securities, data scarcity constrains applicability.
The data requirements are compounded by the need for out-of-sample validation. Reserving 20-40% of data for validation reduces the effective training set, potentially degrading performance. This trade-off between training data quantity and validation rigor is unavoidable.
Computational Barriers.
Despite advances in hardware and algorithms, computational requirements remain substantial. Training deep RL policies can require weeks on multi-GPU systems. Large-scale evolutionary algorithms demand distributed computing infrastructure. While LLM-based approaches benefit from pretraining, the validation burden (backtesting thousands of candidates) is computationally intensive.
These computational barriers limit accessibility to well-resourced organizations and constrain the frequency of feature regeneration. Cloud computing and specialized hardware (TPUs, FPGAs) partially address these limitations but introduce additional costs.
Interpretability vs Regulatory Requirements.
Regulatory frameworks in many jurisdictions require explainability of algorithmic trading strategies. Symbolic systems producing explicit formulas align well with these requirements. Deep RL black boxes face regulatory hurdles. LLM-generated formulas with natural language rationales occupy a middle ground but may face scrutiny regarding the reliability of rationales.
The tension between performance and regulatory compliance constrains methodology choice. Organizations in heavily regulated environments may be forced to accept performance limitations of interpretable methods, while those in less regulated contexts can pursue black-box approaches.
9.3 Validation and Statistical Rigor
Multiple Hypothesis Testing.
Testing numerous automatically generated features on the same dataset introduces severe multiple hypothesis testing problems. The probability of finding spurious significant results increases with the number of tests. While corrections (Bonferroni, FDR control) exist, they reduce statistical power.
A more fundamental issue is that the effective number of independent tests is difficult to quantify. Evolutionary algorithms implicitly test millions of candidates through fitness evaluations. Deep RL explores vast policy spaces through gradient updates. The total number of hypotheses implicitly tested is orders of magnitude larger than the number of final candidates, yet standard corrections assume a known number of tests.
Look-Ahead Bias.
Automated systems can inadvertently introduce look-ahead bias through subtle mechanisms. For example, if hyperparameters are selected based on test set performance and then the system is retrained, information leakage occurs. Rigorous protocols separating training, validation, and test data are essential but require discipline.
Transaction Cost Realism.
Academic studies often omit transaction costs or use optimistic estimates. Realistic costs including bid-ask spreads, market impact, and commission substantially reduce net returns. High-turnover strategies discovered by automated systems may appear profitable in backtests but fail in live trading.
Incorporating transaction costs into fitness functions or reward signals is essential but introduces additional complexity. The optimal feature depends on the cost model, and cost models themselves are uncertain and market-dependent.
9.4 Practical Implementation Considerations
Infrastructure Requirements.
Deploying automated feature construction systems requires substantial infrastructure: distributed computing for training, low-latency execution for inference, robust backtesting frameworks, real-time monitoring, and data pipelines. These requirements may be prohibitive for smaller organizations.
Human Expertise.
Despite automation, human expertise remains critical. Domain knowledge guides primitive set design, reward function specification, and validation criteria. Interpreting results and making deployment decisions requires experienced practitioners. Automated systems augment rather than replace human judgment.
Maintenance and Monitoring.
Automated systems require continuous monitoring for performance degradation, regime shifts, and unexpected behavior. Factor decay necessitates periodic regeneration. This ongoing maintenance burden must be factored into total cost of ownership.
9.5 Ethical and Market Impact Considerations
Market Efficiency Implications.
Widespread adoption of automated feature discovery could accelerate market efficiency by rapidly identifying and exploiting inefficiencies. This may reduce the persistence of patterns, creating a feedback loop where automation undermines its own effectiveness. The long-term equilibrium impact on market dynamics is uncertain.
Systemic Risk.
If many market participants employ similar automated systems, correlated trading behavior could emerge, potentially amplifying market volatility during stress periods. The concentration of algorithmic approaches introduces systemic risk that individual organizations may not fully internalize.
Fairness and Access.
Sophisticated automated systems require substantial computational resources and expertise, potentially creating advantages for well-resourced organizations. This raises questions about fairness and market access. However, the democratization of machine learning tools and cloud computing may partially mitigate these concerns.
9.6 Future Research Directions
Causal Feature Discovery.
Current approaches focus on correlation-based features. Developing methods for causal feature discovery—identifying features representing causal relationships rather than mere correlations—would enhance robustness and interpretability. Causal inference frameworks integrated with automated search represent a promising direction.
Meta-Learning for Rapid Adaptation.
Meta-learning approaches that learn to learn could enable rapid adaptation to new regimes with minimal additional data. Training systems to quickly adapt feature construction policies based on limited observations of regime shifts would address a key limitation of current methods.
Federated Feature Discovery.
Federated learning enables collaborative feature discovery without sharing proprietary data. Multiple organizations could jointly train systems while preserving data privacy. This could accelerate progress while addressing competitive concerns.
Quantum Computing Applications.
Quantum algorithms for optimization and search could potentially address computational barriers in large-scale feature discovery. While practical quantum advantage remains distant, monitoring developments in quantum computing for potential applications is warranted.
Explainable Deep Learning.
Advances in explainable AI could bridge the interpretability gap for deep RL systems. Methods for extracting interpretable rules from trained policies or visualizing decision processes would enhance regulatory acceptability and practitioner trust.
9.7 Limitations of This Study
This systematic study has several limitations. The empirical evidence synthesized comes from published literature, which may suffer from publication bias toward positive results. Direct experimental comparison across methodologies on standardized datasets would strengthen con-clusions but was beyond the scope of this work.
The proposed hybrid architecture has not been empirically validated at scale. While the theoretical foundations are sound, practical performance requires extensive testing across diverse markets and conditions. The computational requirements and implementation complexity may be barriers to adoption.
The focus on equity markets limits generalizability. Fixed income, foreign exchange, and commodity markets have distinct characteristics that may favor different methodological approaches. Cross-asset validation of findings is needed.
Finally, the rapid pace of development in machine learning means that new approaches may emerge that supersede current methods. This study provides a snapshot of the current landscape but cannot anticipate future innovations.
10 Conclusion
This paper has presented a comprehensive systematic study of intelligent automated systems for feature and factor mining in quantitative trading. Through rigorous analysis of symbolic systems, deep reinforcement learning approaches, and large language model-based methods, we have characterized the fundamental capabilities, limitations, and trade-offs inherent in each paradigm.
10.1 Principal Findings
The empirical evidence demonstrates that automated feature construction systems can achieve substantial performance improvements, with reported excess returns ranging from 20% to 30% across different methodologies and markets. Symbolic systems employing genetic programming and transformer-based symbolic regression produce interpretable formulas suitable for regulatory environments. Deep reinforcement learning approaches enable adaptive feature construction with online learning capabilities. Large language model-based systems offer rapid generation and multimodal integration, though requiring rigorous validation.
Each methodology embodies distinct trade-offs between interpretability, expressiveness, computational efficiency, and adaptability. Symbolic systems prioritize interpretability at the cost of limited expressiveness and substantial computational requirements for evolution. Deep RL systems achieve high expressiveness and adaptability but sacrifice interpretability and demand extensive training resources. LLM-based approaches provide rapid generation but require careful validation to filter spurious patterns.
The proposed hybrid architecture, combining transformer-based symbolic generation with reinforcement learning refinement, addresses limitations of individual approaches by maintaining interpretability while incorporating adaptive capability. The two-stage process leverages the complementary strengths of sequence-to-sequence modeling and policy-based optimization.
10.2 Theoretical Contributions
We have developed a unified mathematical framework formalizing the feature construction problem across methodologies, enabling rigorous comparison of theoretical properties. This framework reveals that the fundamental trade-offs between interpretability, expressiveness, and computational tractability are not artifacts of current implementations but reflect inherent mathematical constraints.
The analysis of search space complexity, generalization bounds, and computational requirements provides theoretical grounding for understanding performance characteristics. The formulation of multi-objective optimization incorporating performance, interpretability, efficiency, and robustness clarifies the Pareto frontier of design choices.
10.3 Practical Implications
For practitioners, the choice of methodology should be guided by deployment requirements rather than solely by reported performance metrics. Regulatory environments requiring explainability favor symbolic systems. Nonstationary markets requiring continuous adaptation favor deep RL approaches. Research and exploration contexts benefit from LLM-based rapid generation. The comprehensive evaluation framework developed in this paper provides systematic procedures for validation, encompassing statistical significance testing, economic performance assessment, out-of-sample validation, robustness testing, and overfitting detection. Rigorous application of this framework is essential for distinguishing genuine predictive patterns from statistical artifacts.
The computational requirements, infrastructure needs, and maintenance burdens of automated systems must be carefully considered. While automation reduces manual effort in feature engineering, it introduces new requirements for computational resources, monitoring infrastructure, and expert oversight.
10.4 Research Directions
Several promising research directions emerge from this study. Causal feature discovery methods that identify causal relationships rather than correlations would enhance robustness. Meta-learning approaches enabling rapid adaptation to regime shifts with minimal data would address a key limitation. Federated learning frameworks could enable collaborative feature discovery while preserving data privacy. Advances in explainable AI could bridge the interpretability gap for deep learning systems.
The integration of domain knowledge with automated search remains an open challenge. While current systems incorporate domain knowledge through primitive set design and reward function specification, more sophisticated integration mechanisms could improve both efficiency and interpretability. Hybrid human-AI systems that combine automated search with expert judgment represent a promising paradigm.
10.5 Broader Context
Automated feature construction represents one component of the broader trend toward algorithmic trading and artificial intelligence in financial markets. The implications extend beyond individual organizations to market structure, efficiency, and systemic risk. As these systems become more prevalent, understanding their collective impact on market dynamics becomes increasingly important.
The democratization of machine learning tools and computational resources may level the playing field, enabling smaller organizations to compete with large institutions. However, the expertise required to effectively deploy these systems remains a significant barrier. Education and training in quantitative finance and machine learning will be essential for preparing the next generation of practitioners.
10.6 Final Remarks
The automation of feature and factor construction represents a significant advancement in quantitative finance, offering the potential for systematic discovery of predictive patterns at scale. However, automation does not eliminate the need for domain expertise, rigorous validation, and careful risk management. The most successful implementations will likely be those that combine the efficiency and scale of automation with the judgment and economic intuition of experienced practitioners.
The field remains dynamic, with rapid developments in machine learning methodologies and computational capabilities. The frameworks and analyses presented in this paper provide a foundation for understanding current approaches and evaluating future innovations. As the technology matures, continued research into theoretical foundations, empirical validation, and practical deployment will be essential for realizing the full potential of automated feature construction while managing associated risks.
The journey from manual feature engineering to intelligent automated systems reflects the broader evolution of quantitative finance toward data-driven, algorithmic approaches. This transformation presents both opportunities and challenges. By maintaining rigorous standards of validation, transparency, and risk management, the field can harness the power of automation while preserving the discipline and rigor essential for sustainable success in financial markets.
References
[1] Christodoulaki, E., Kampouridis, M., and Kyropoulou, M. (2023). Enhanced Strongly typed Genetic Programming for Algorithmic Trading. Proceedings of the Genetic and Evolutionary Computation Conference. DOI: 10.1145/3583131.3590359
[2] Xu, W., Chen, J., Li, C., et al. (2025). Mining Intraday Risk Factor Collections via Hierarchical Reinforcement Learning based on Transferred Options. arXiv preprint arXiv:2501.07274.
[3] Xu, W., Wang, R., Li, C., et al. (2024). HRFT: Mining High-Frequency Risk Factor Collections End-to-End via Transformer. arXiv preprint arXiv:2408.01271.
[4] Zhao, J., Zhang, C., Qin, M. J., et al. (2024). QuantFactor REINFORCE: Mining Steady Formulaic Alpha Factors with Variance-bounded REINFORCE. arXiv preprint arXiv:2409.05144.
[5] Zhang, T., Li, Y., Jin, Y., et al. (2020). AutoAlpha: an Efficient Hierarchical Evolutionary arXiv: Computational Algorithm for Mining Alpha Factors in Quantitative Investment. Finance.
[6] Lei, K., Zhang, B., Li, Y., et al. (2020). Time-driven feature-aware jointly deep reinforcement Expert Systems with learning for financial signal representation and algorithmic trading. Applications, 140, 112872.
[7] Wang, Z., and Leung, N. (2018). Factor Selection with Deep Reinforcement Learning for Financial Forecasting. Social Science Research Network. DOI: 10.2139/SSRN.3128678
[8] AlphaQuant: LLM-Driven Automated Robust Feature Engineering for Quantitative Finance. (2024). SSRN Working Paper 5124841.
[9] Guo, J., Wang, S., Ni, L. M., et al. (2024). Quant 4.0: engineering quantitative investment with automated, explainable, and knowledge-driven artificial intelligence. Frontiers of Information Technology & Electronic Engineering, 25(11), 1453–1457.
[10] Ren, J., Zhao, J., Liu, S., et al. (2025). From Linear to Hierarchical: Evolving Treestructured Thoughts for Efficient Alpha Mining. arXiv preprint arXiv:2508.16334.
[11] Wang, Y., and Wei, Q. (2025). Event-Aware Sentiment Factors from LLM-Augmented Financial Tweets: A Transparent Framework for Interpretable Quant Trading. arXiv preprint arXiv:2508.07408.
[12] Kaboudan, M. A. (2000). Genetic Programming Prediction of Stock Prices. Computing in Economics and Finance, 16(3), 207–236.
[13] Long, X., Kampouridis, M., and Kanellopoulos, P. (2025). An In-Depth Investigation of Genetic Programming Under Physical Time and Directional Change Frameworks for Algorithmic Trading. IEEE Access, 13, 7099–7115.
[14] Manahov, V., and Zhang, H. (2019). Forecasting Financial Markets Using High-Frequency Trading Data: Examination with Strongly Typed Genetic Programming. International Journal of Electronic Commerce, 23(1), 70–96.