
Agentic Trading for User Preference-Driven Strategy Selection
A comprehensive design for LLM-based multi-agent quantitative portfolio construction
This agentic trading system turns natural-language investor preferences into explainable strategy selection, AI portfolio optimization and deployment decisions using specialist agents, deterministic validation tools and RAG trading workflows.
Abstract
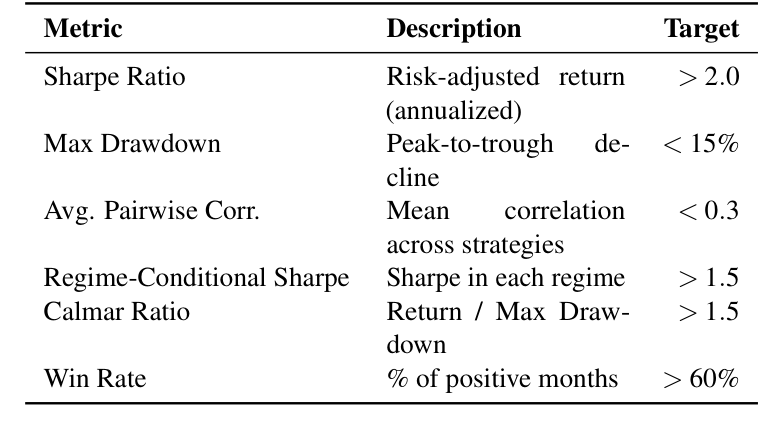
This work presents a comprehensive design for a novel LLM-based multi-agent system that recommends, deploys, and combines uncorrelated quantitative trading strategies from a growing third-party strategy marketplace. Unlike traditional reinforcement learning approaches, this system leverages large language models as intelligent reasoning engines capable of understanding investor preferences through natural language conversation, performing chain-of-thought analysis over structured strategy metadata, orchestrating specialized validation tools, and generating explainable portfolio construction decisions. The architecture decomposes responsibilities across six specialized agents—User Profiler, Strategy Analyst, Portfolio Constructor, Risk Manager, Deployment Agent, and Monitoring Agent—coordinated by an Orchestrator/Planner LLM. Strategies are provided by third-party vendors as microservices, with the platform accessing only API-exposed signals, performance metrics, and metadata, never the underlying strategy code. The system maintains a vector-indexed strategy registry, uses retrieval-augmented generation to ground recommendations in verifiable evidence, and integrates deterministic tools for validation. Market regime detection enables dynamic strategy suitability mapping, while a continuous onboarding pipeline scales the marketplace. The system targets a composite evaluation score above 0.75, combining Sharpe ratio above 2.0, maximum drawdown below 15%, average pairwise correlation below 0.3, regime-conditional Sharpe above 1.5, and reasoning coherence above 4.0 out of 5.0.
1 Introduction
Quantitative trading has evolved from single-strategy execution to sophisticated portfolio construction combining multiple uncorrelated alphas. Traditional approaches rely on manual strategy selection, rigid optimization frameworks, or reinforcement learning agents that lack interpretability. The emergence of large language models with reasoning capabilities, tool use, and natural language understanding enables a new paradigm: LLM-based agentic systems that can understand investor preferences through conversation, reason over structured strategy metadata, orchestrate validation tools, and explain portfolio decisions in natural language.
This work designs a comprehensive multi-agent LLM system for a growing quantitative strategy marketplace. The system addresses five core challenges:
- Preference elicitation: Understanding user risk-return profiles through natural language conversation rather than rigid questionnaires.
- Strategy discovery: Efficiently retrieving relevant strategies from a large, growing marketplace using semantic search and metadata filtering.
- Portfolio construction: Combining strategies with complementary characteristics to optimize risk-adjusted returns while respecting user constraints.
- Regime adaptation: Dynamically adjusting strategy selection based on real-time market conditions.
- Explainability: Providing transparent, auditable reasoning chains for every portfolio decision.
The system operates in a microservice ecosystem where third-party strategy vendors retain full IP protection. The platform accesses only API-exposed historical signals, real-time signals post-deployment, and derived performance metrics. This constraint shapes the entire architecture, requiring inference-based analysis rather than code inspection.
Key Contributions
- Novel multi-agent LLM architecture specialized for quantitative strategy marketplaces
- Microservice-native design preserving third-party vendor IP
- RAG-grounded reasoning preventing hallucination in portfolio construction
- Regime-aware adaptive strategy selection with realtime market data integration
- Comprehensive 18-month implementation roadmap
2 Agentic Trading System Architecture
The system is organized into four hierarchical layers, each with distinct responsibilities and interaction patterns.
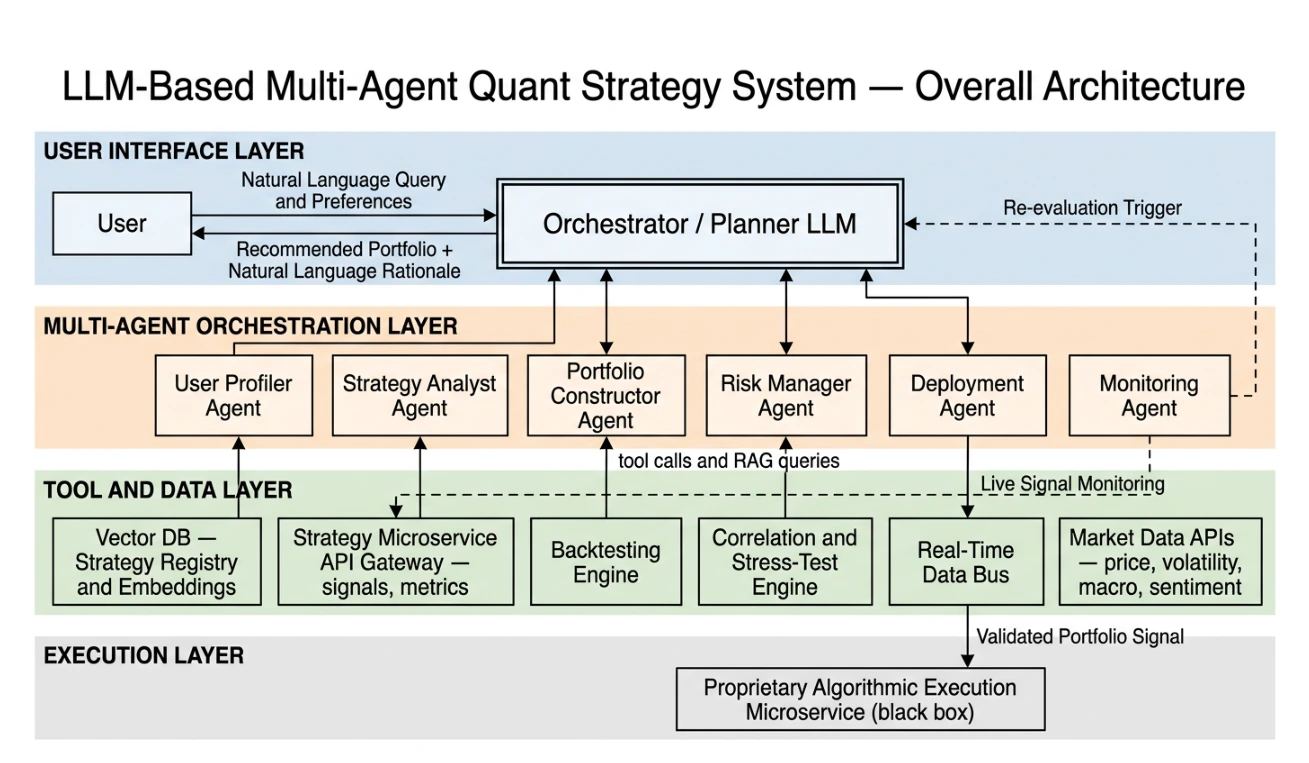
Figure 1 — Four-layer LLM-based multi-agent system architecture showing the User Interface Layer, Multi-Agent Orchestration Layer, Tool & Data Layer, and Execution Layer.
2.1 Four-Layer Architecture
Layer 1 – User Interface Layer. Natural language input from investors is received through a conversational interface. The interface maintains session context and routes requests to the Orchestrator/Planner LLM. User preference profiles from previous sessions are retrieved to personalize interactions.
Layer 2 – Multi-Agent Orchestration Layer. The Orchestrator decomposes user requests into subtasks and routes them to six specialist agents. Each agent maintains its own context window, tool access, and reasoning chain. Agents communicate through structured message passing with typed schemas.
Layer 3 – Tool & Data Layer. A suite of deterministic tools provides validated inputs to agent reasoning: vector database for semantic search, strategy microservice API gateway, backtesting engine, correlation engine, real-time data bus, and market data APIs. Tools are invoked via structured function calls with schema-validated inputs and outputs.
Layer 4 – Execution Layer. A proprietary algorithmic execution microservice receives validated portfolio signals from the Deployment Agent. The agentic system’s responsibility ends at portfolio signal generation; execution mechanics, order routing, and position management are handled entirely by this black-box service.
2.2 Information Flow
The primary workflow proceeds as follows: the user expresses portfolio objectives in natural language; the Orchestrator parses intent and activates the User Profiler; the User Profiler elicits and formalizes constraints; the Strategy Analyst retrieves and ranks candidates; the Portfolio Constructor allo-cates weights; the Risk Manager validates the proposal; the Deployment Agent packages and transmits signals; and the Monitoring Agent tracks live performance.
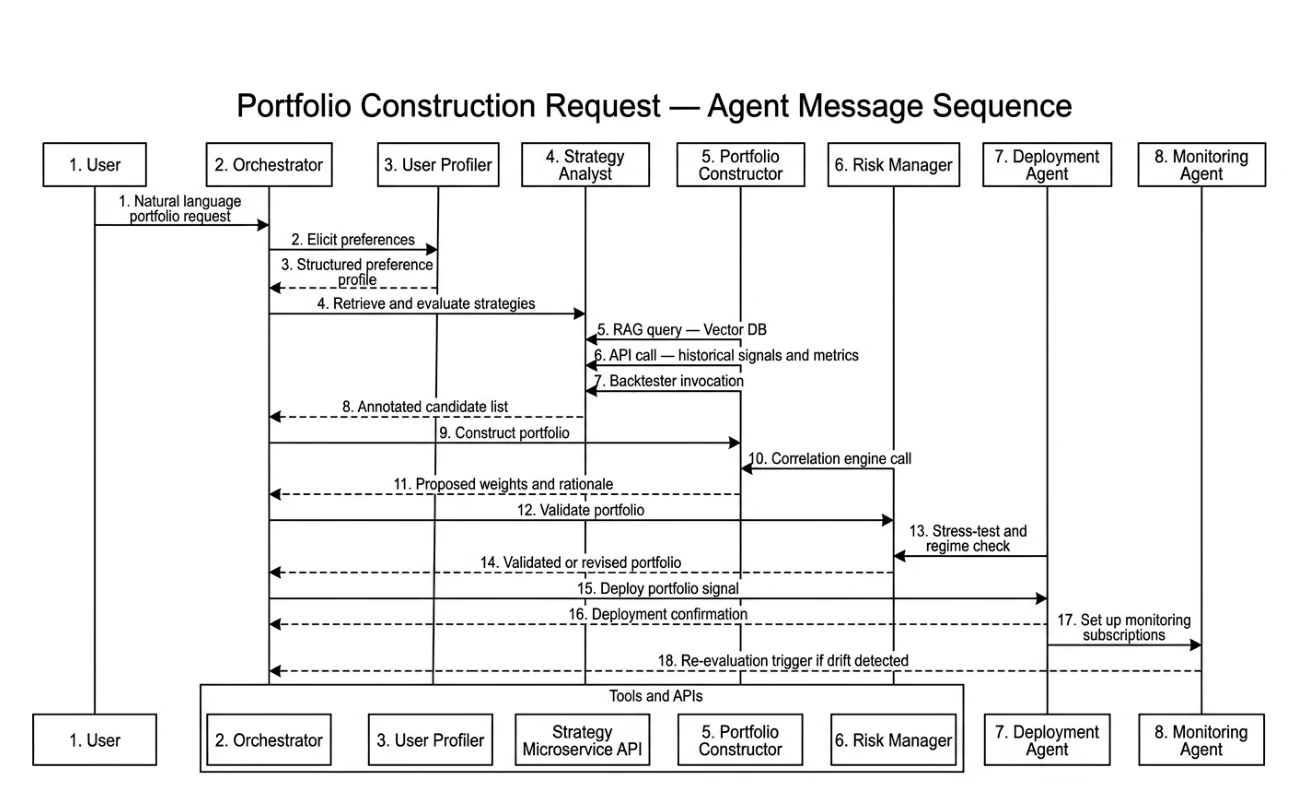
Figure 2 — UML sequence diagram showing the agent message flow for portfolio construction, from user input through deployment.
3 Agent Role Decomposition
The multi-agent architecture decomposes the complex portfolio construction task into specialized responsibilities, enabling parallel execution, independent optimization, and clear accountability.
3.1 Orchestrator / Planner Agent
The Orchestrator is the central coordinating intelligence of the system. It receives raw user requests, interprets intent, decomposes tasks into a directed acyclic graph (DAG) of subtasks, routes subtasks to appropriate specialist agents, monitors execution progress, handles failures and retries, and synthesizes results into coherent user-facing responses. The Orchestrator maintains a global task state that tracks which agents are active, what results have been received, and what decisions remain pending. It uses chain-of-thought reasoning to determine the optimal agent activation sequence, often executing multiple agents in parallel when subtasks are independent.
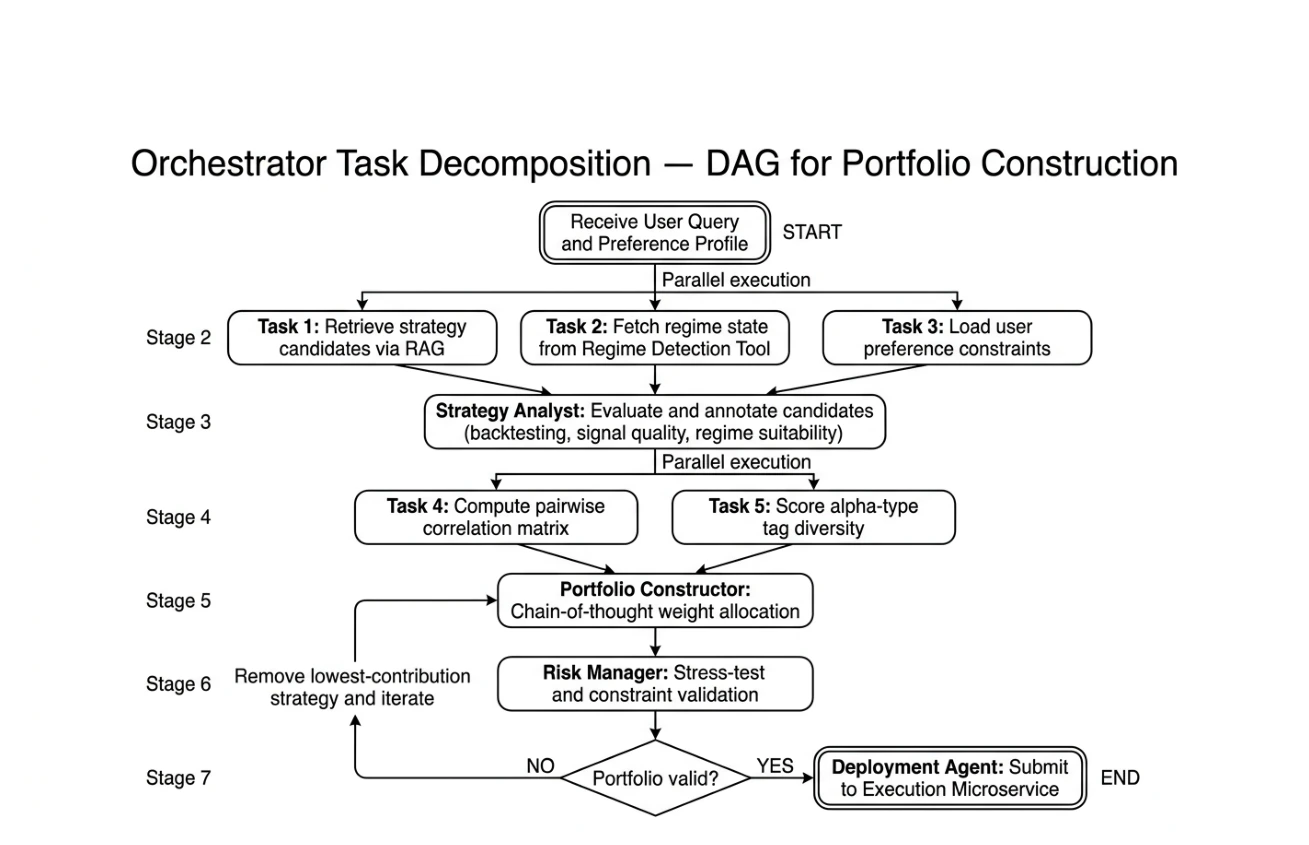
Figure 3 — Task decomposition DAG showing parallel and sequential execution paths for portfolio construction.
3.2 User Profiler Agent
The User Profiler conducts structured yet conversational elicitation of investor preferences. It maps natural language expressions to quantitative constraints, resolves ambiguities through targeted follow-up questions, and maintains a persistent preference profile updated across sessions.
The elicitation process covers six dimensions: risk tolerance (expressed as acceptable drawdown or volatility), return targets (absolute or benchmark-relative), investment horizon (short, medium, long-term), liquidity requirements (daily, weekly, monthly redemption), alpha-type preferences (trend-following, mean-reversion, event-driven, machine learning-based), and market exposure constraints (asset class, geography, sector).
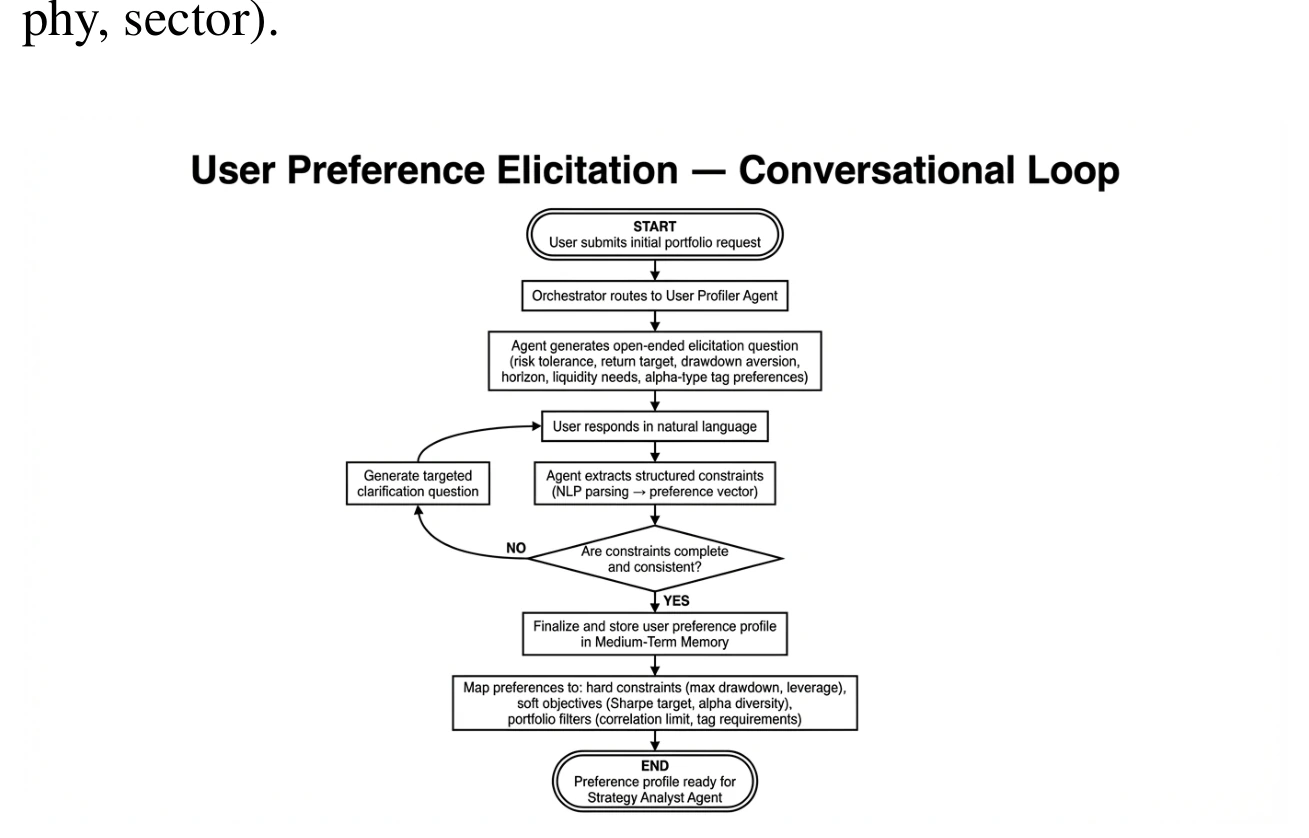
Figure 4 — Conversational preference elicitation loop showing the iterative dialogue between user and User Profiler Agent.
3.3 Strategy Analyst Agent
The Strategy Analyst is responsible for candidate discovery, evaluation, and ranking. It uses RAG to retrieve semantically relevant strategies from the vector-indexed registry, ana-lyzes performance metrics and signal characteristics, assesses regime suitability, computes diversification scores, and pro-duces ranked candidate lists with supporting evidence.
The agent’s reasoning pipeline follows a retrieve-then-validate pattern: semantic search retrieves an initial candidate set; metadata filters narrow the set based on hard constraints; performance analysis scores candidates on risk-adjusted metrics; regime analysis assesses suitability under current market conditions; and a final ranking combines all scores into a composite recommendation.
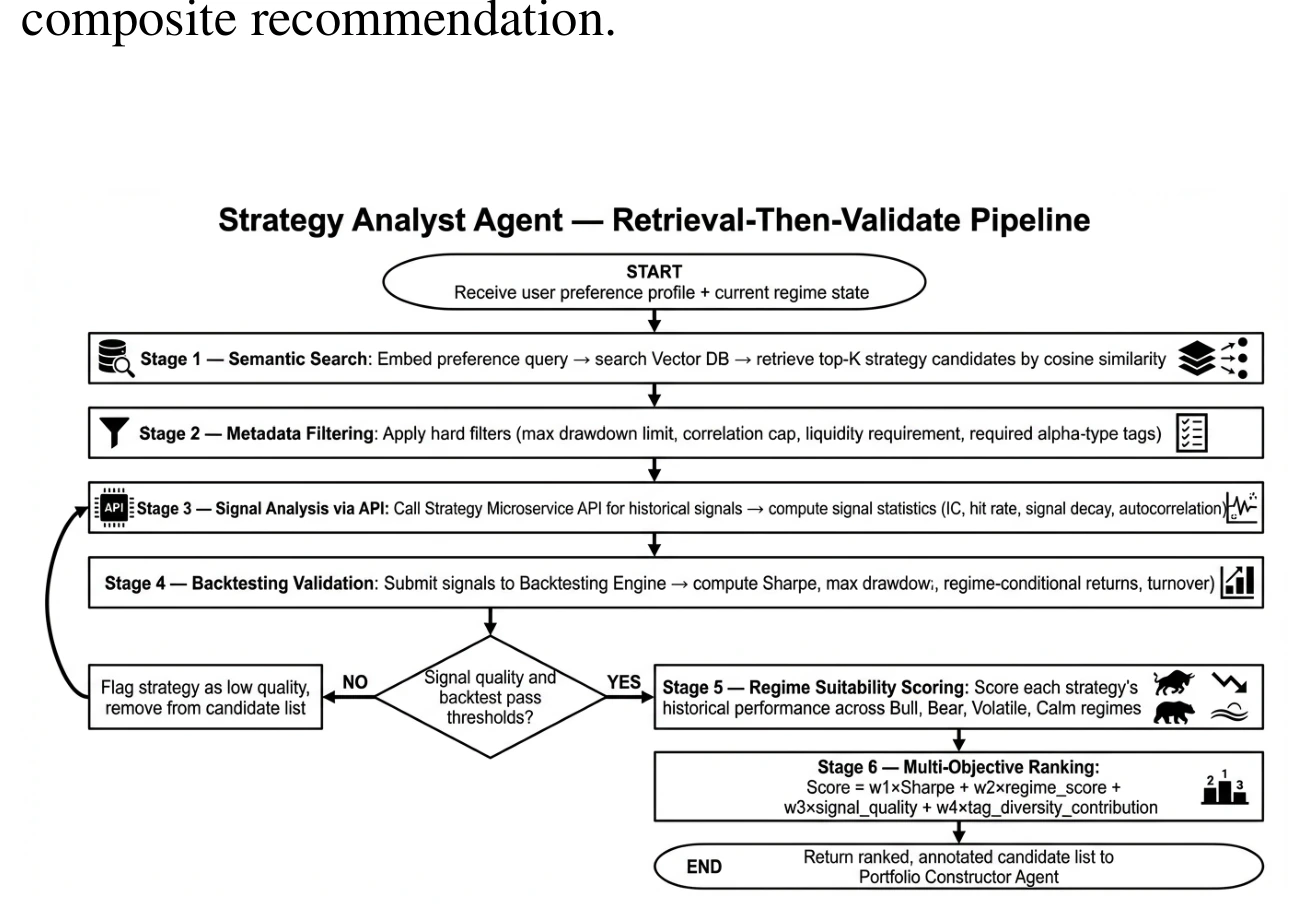
Figure 5 — Strategy Analyst retrieval-then-validate pipeline showing the multistage candidate evaluation process.
3.4 Portfolio Constructor Agent
The Portfolio Constructor translates ranked strategy candidates into an optimized portfolio with specific weight allo-cations. It uses chain-of-thought reasoning to justify each allocation decision, balancing return potential, risk contribution, diversification, and user constraints.
The construction algorithm proceeds iteratively: starting with the highest-ranked core strategy, it adds candidates one at a time, computing marginal contribution to portfolio metrics at each step. Strategies that improve the portfolio’s Sharpe ratio while maintaining low correlation and acceptable drawdown are included; others are rejected. Weights are normalized to sum to 1.0 and validated against all user constraints.
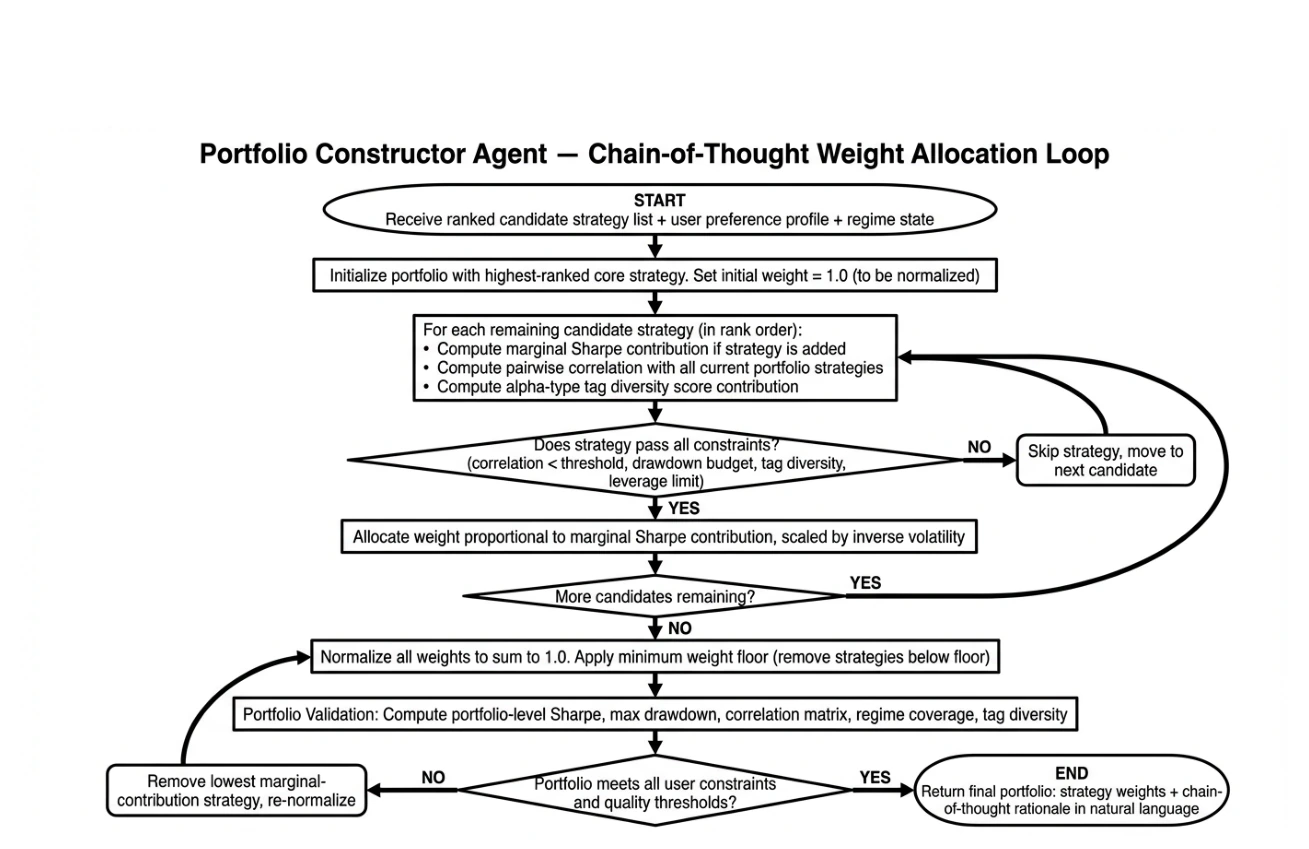
Figure 6 — Portfolio Constructor chain-of-thought weight allocation loop showing iterative candidate inclusion and constraint validation.
3.5 Risk Manager Agent
The Risk Manager performs independent validation of portfolio proposals before deployment. Its responsibilities include regime detection and suitability assessment, stress testing under historical crisis scenarios, constraint verification (drawdown limits, concentration limits, correlation thresholds), and generating rebalancing triggers during live deployment.
The agent operates in two modes: pre-deployment validation (synchronous, blocking) and live monitoring (asynchronous, continuous). In validation mode, it must approve a portfolio before the Deployment Agent can proceed. In monitoring mode, it continuously evaluates live performance against thresholds and triggers re-evaluation when conditions warrant.
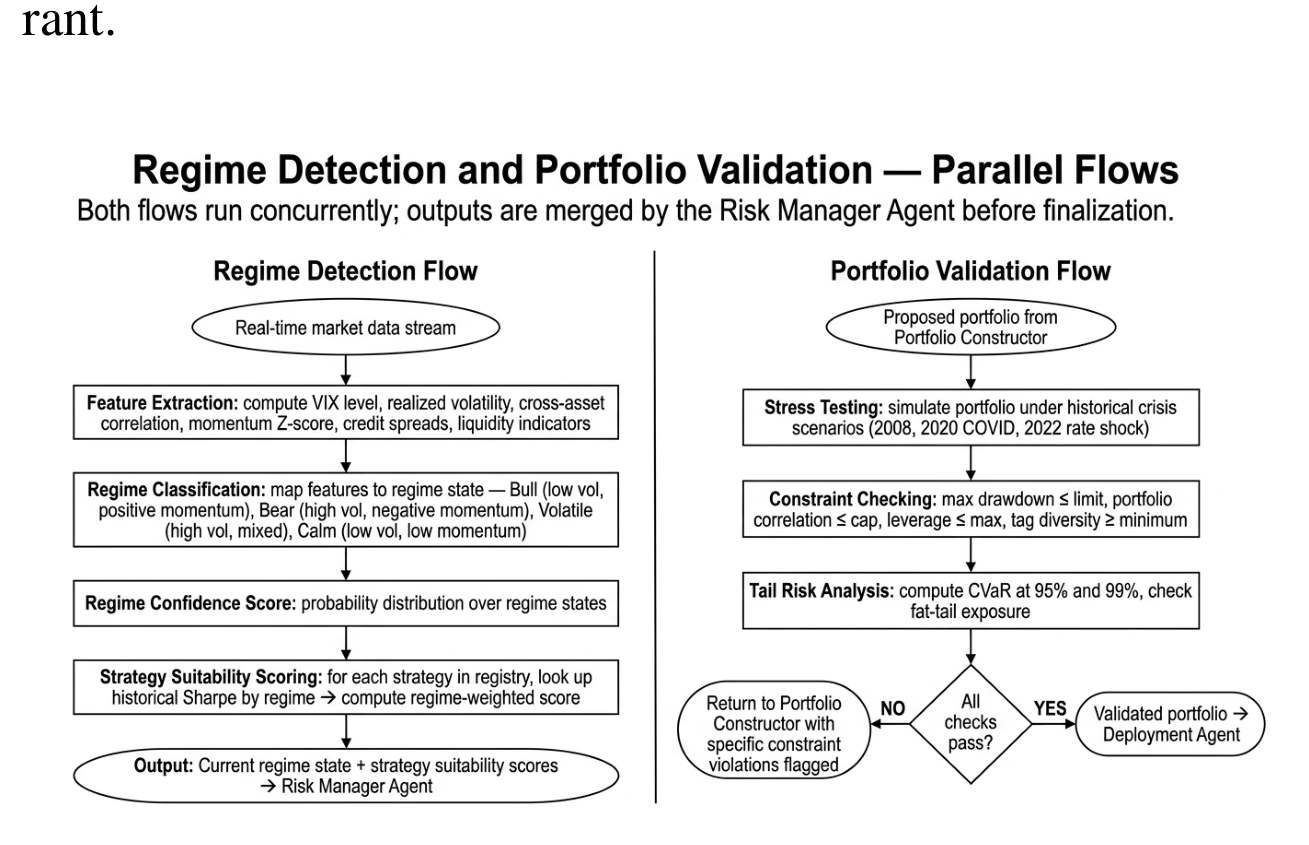
Figure 7 — Parallel execution flows for regime detection and portfolio validation showing the Risk Manager’s dual responsibilities.
3.6 Deployment Agent
The Deployment Agent packages validated portfolio spec-ifications for transmission to the proprietary execution microservice. It translates portfolio weights and strategy signal metadata into the execution service’s required schema, handles authentication and secure transmission, confirms receipt and acknowledgment, and sets up monitoring hooks for the Monitoring Agent.
The Deployment Agent does not make portfolio decisions; it acts purely as a translation and transmission layer. All portfolio construction and risk validation logic occurs upstream.
3.7 Monitoring Agent
The Monitoring Agent tracks live portfolio performance after deployment. It consumes real-time strategy signals and market data, computes rolling performance metrics, detects drift from expected behavior, monitors threshold violations, and triggers re-evaluation workflows when performance deterio-rates or market conditions change significantly.
4 RAG Trading, Memory and Retrieval Design
4.1 Three-Layer Memory Architecture
The system implements a three-layer memory architecture that balances computational efficiency with information retention across different time horizons.
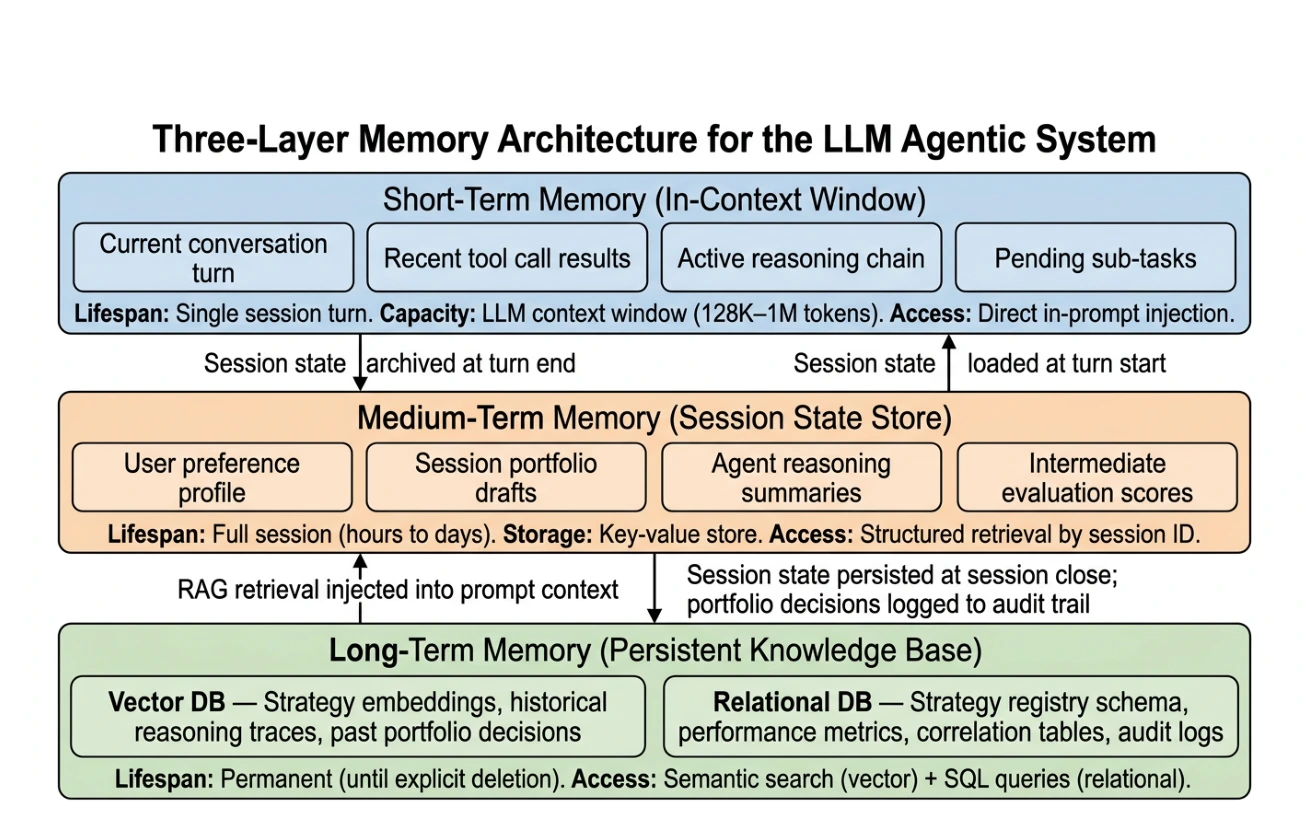
Figure 8 — Three-layer memory architecture showing short-term conversational context, medium-term session state, and long-term persistent registry.
Short-Term Memory maintains the active conversational context: the current turn’s user message, assistant response, tool call results, and the most recent exchanges (typically 5–10 turns). This layer fits within the LLM’s context window and is discarded at session end. It enables coherent multiturn dialogue and prevents repetitive elicitation.
Medium-Term Memory persists session state across the multi-agent workflow: the formalized user preference profile, retrieved strategy candidates, portfolio proposals, validation results, and intermediate reasoning chains. This layer is stored in a fast key-value store (Redis) and survives agent handoffs within a session. It enables the Orchestrator to resume workflows after interruptions and provides audit trails for debugging.
Long-Term Memory is the persistent strategy registry and user profile store: strategy metadata, performance metrics, signal characteristics, embeddings, correlation matrices, historical audit logs, and returning user preference profiles. This layer is stored in a combination of relational database (PostgreSQL) and vector database (Pinecone or Weaviate) for semantic search.
4.2 Strategy Registry Schema
The strategy registry is the central data asset of the system, encoding rich metadata for every strategy in the marketplace.
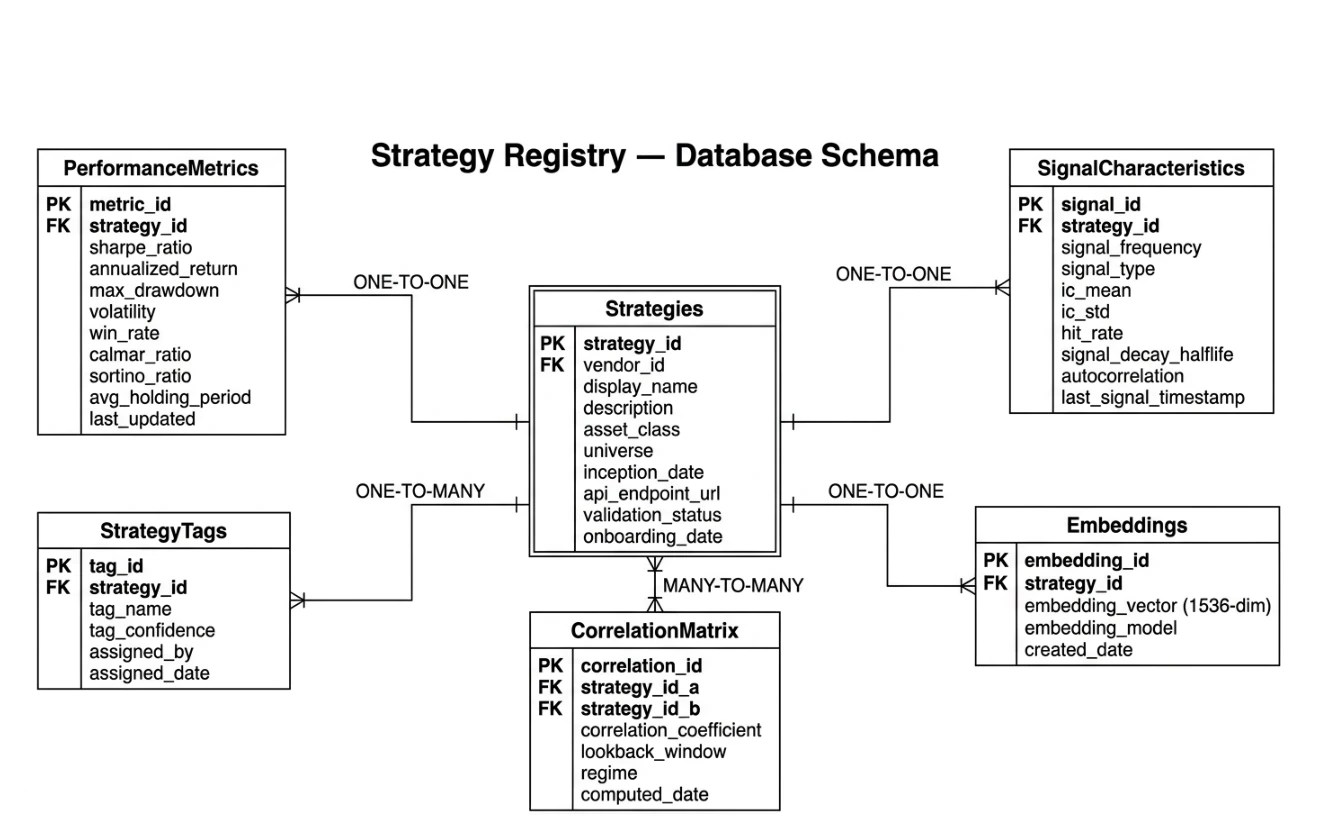
Figure 9 — Entity-relationship diagram of the strategy registry showing the Strategies, PerformanceMetrics, SignalCharacteristics, StrategyTags, CorrelationMatrix, and Embeddings tables.
The schema comprises six core tables:
- Strategies: Core metadata (ID, vendor, name, asset class, API endpoint, validation status, creation date).
- PerformanceMetrics: Sharpe ratio, maximum drawdown, annualized return, volatility, win rate, profit factor, Calmar ratio, and regime-conditional variants of each metric.
- SignalCharacteristics: Signal frequency, information coefficient, hit rate, signal decay half-life, autocorrelation, and turnover.
- StrategyTags: Flexible metadata tags (trend-following, mean-reversion, event-driven, ML/DL, high-frequency, macro, alternative data, etc.). Multiple tags per strategy; extensible as marketplace grows.
- CorrelationMatrix: Pairwise correlations between strategies, updated monthly and under regime-conditional conditions.
- Embeddings: 1536-dimensional vector embeddings of strategy metadata for semantic similarity search.
4.3 RAG Pipeline
Retrieval-augmented generation grounds all agent reasoning in verified strategy metadata, preventing hallucination and ensuring recommendations are traceable to specific data points.
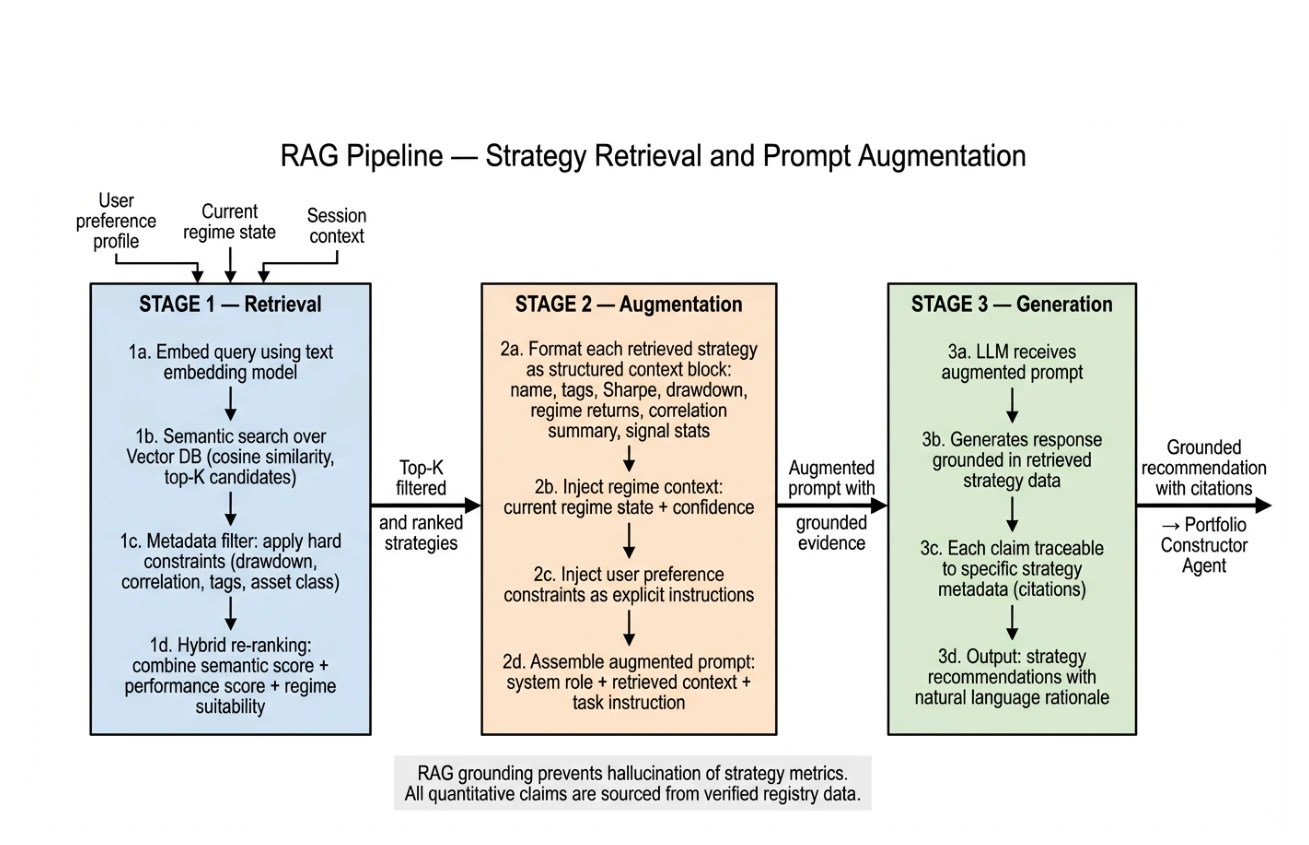
Figure 10 — RAG pipeline showing the retrieval, augmentation, and generation stages for strategy recommendation.
The RAG pipeline operates in three stages: Retrieval: The user preference profile is encoded as a query embedding. Approximate nearest neighbor search over the strategy embedding space returns a candidate set (typically 20–50 strategies). Hard metadata filters (asset class, minimum Sharpe, maximum drawdown) narrow the set to 10–20 candidates. Augmentation: Retrieved strategy metadata is formatted into structured context blocks appended to the agent’s prompt. Each context block contains the strategy’s performance metrics, signal characteristics, regime performance, and tags. The agent is instructed to cite specific data points in its reasoning. Generation: The agent generates a recommendation with explicit citations to retrieved metadata. The reasoning chain is structured as: hypothesis (why this strategy fits the user’s profile) → evidence (specific metrics supporting the hypothesis) → caveats (limitations or risks) → conclusion (recommendation with confidence level).
5 Tool Integration Layer
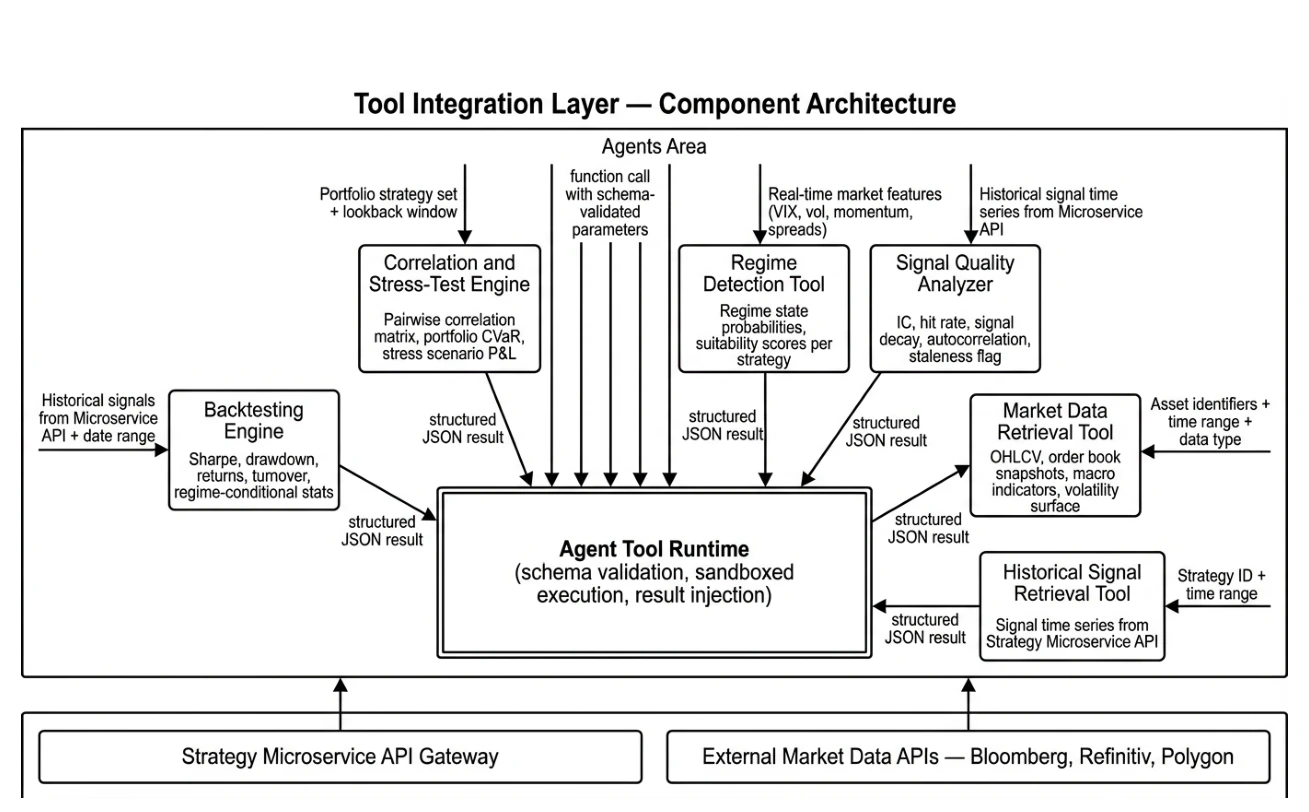
Figure 11 — Tool integration layer architecture showing the six core tools and their connections to the multi-agent orchestration layer.
The tool integration layer provides deterministic, validated computation that complements LLM reasoning. Tools are invoked through structured function calls with schema-validated inputs and outputs, ensuring reproducibility and auditability.
5.1 Backtesting Engine
The backtesting engine replays historical strategy signals against market data to compute performance metrics. It ingests signal time series from the strategy microservice API, applies transaction cost models, computes returns, and outputs a standardized performance report. The engine supports walk-forward validation, out-of-sample testing, and regime-conditional performance analysis.
5.2 Correlation and Covariance Engine
This tool computes pairwise correlations and covariance matrices between strategy return streams. It supports rolling correlation windows (30-day, 90-day, 252-day), regime-conditional correlations (high-volatility vs. low-volatility regimes), and tail correlations (behavior during extreme market events). Outputs feed directly into portfolio construction optimization.
5.3 Stress-Test Engine
The stress-test engine simulates portfolio performance under historical crisis scenarios: 2008 Global Financial Crisis, 2010 Flash Crash, 2011 European Debt Crisis, 2015 China Devaluation, 2020 COVID-19 Crash, 2022 Rate Shock. For each scenario, it applies the corresponding market shocks to strategy signals and computes portfolio drawdown, recovery time, and Sharpe degradation.
5.4 Regime Detection Tool
The regime detection tool classifies current market conditions into one of five regimes: high-volatility trending, low-volatility trending, high-volatility mean-reverting, low-volatility mean-reverting, and crisis/tail-risk. It uses a combination of VIX levels, realized volatility, cross-asset correlations, momentum indicators, and macro economic indicators as inputs. The tool outputs a regime probability distribution, not a hard classification, enabling soft weighting of regime-conditional strategy scores.
5.5 Signal Quality Analyzer
This tool assesses the quality and persistence of strategy signals. It computes information coefficient (IC) between signals and forward returns, IC stability over time, signal decay half-life, hit rate across different market conditions, and turnover (trading frequency). High-quality signals exhibit consistent IC above 0.05, low decay, and stable hit rates across regimes.
5.6 Market Data Retrieval Tool
The market data retrieval tool provides on-demand access to historical and current market data: OHLCV price data, order book snapshots, implied volatility surfaces, macro economic indicators, and alternative data feeds. It abstracts over multiple data providers (Bloomberg, Refinitiv, Polygon) and normalizes data formats for downstream consumption.
6 LLMs in Finance: Reasoning Patterns and Prompt Design
6.1 Chain-of-Thought Reasoning
Chain-of-thought (CoT) prompting structures LLM reasoning as explicit, step-by-step deliberation rather than direct answer generation. For portfolio construction, CoT reasoning proceeds through a defined sequence: state the portfolio objective; list available candidates with key metrics; reason about each candidate’s contribution; propose a weight allocation; verify constraints; and state the final recommendation with confidence.
This structured reasoning serves multiple purposes: it improves decision quality by forcing systematic analysis, it generates auditable reasoning chains for compliance review, it enables debugging when recommendations are suboptimal, and it provides users with transparent explanations of portfolio decisions.
6.2 Retrieval-Augmented Generation
RAG prevents hallucination by grounding all agent reasoning in retrieved, verified data. Every factual claim in an agent’s reasoning chain must be supported by a specific data point from the retrieved context. Agents are prompted to explicitly cite the source metric for each claim (e.g., “Strategy X has a Sharpe ratio of 1.8 as reported in its PerformanceMetrics record”).
6.3 Tool-Augmented Reasoning
Agents invoke deterministic tools at specific reasoning steps to obtain validated numerical results. The pattern follows: reason to the point where a numerical validation is needed; invoke the appropriate tool with structured inputs; receive validated results; incorporate results into the reasoning chain; continue reasoning. This hybrid approach combines LLM flexibility with deterministic tool reliability.
6.4 Multi-Agent Coordination Patterns
The system implements three coordination patterns:
Sequential handoff: The Orchestrator activates agents in sequence, passing the output of each agent as input to the next. Used for the primary portfolio construction workflow where each step depends on the previous.
Parallel execution: The Orchestrator activates multiple agents simultaneously for independent subtasks. Used for regime detection and stress testing, which can proceed concurrently with strategy ranking. Adversarial validation: The Risk Manager acts as an independent critic of the Portfolio Constructor’s proposals. This adversarial dynamic improves proposal quality and catches constraint violations before deployment.
7 AI Portfolio Optimization via LLMs
7.1 Construction Algorithm
The portfolio construction algorithm combines LLM reasoning with deterministic optimization. The LLM provides strategic judgment (which strategies to consider, how to balance competing objectives, how to handle edge cases), while deterministic tools provide numerical validation (correlation matrices, constraint checking, metric computation). The algorithm proceeds as follows:
- Initialization: Select the highest-ranked strategy as the core holding. Set its weight to 1.0 (to be normalized later).
- Candidate evaluation: For each remaining candidate in the ranked list, compute marginal contribution to portfolio Sharpe ratio if added at a preliminary weight.
- Inclusion decision: Include candidates that improve portfolio Sharpe by at least 0.1 and maintain average pairwise correlation below 0.3.
- Weight allocation: Use the LLM’s chain-of-thought reasoning to propose weights based on relative Sharpe ratios, risk contributions, and diversification scores.
- Normalization: Normalize weights to sum to 1.0.
- Constraint validation: Check all user constraints (drawdown limit, concentration limit, asset class exposure). If violated, remove the lowest-contribution strategy and repeat from step 4.
- Final validation: Submit to Risk Manager for independent validation.
7.2 Regime-Adjusted Weighting
Portfolio weights are adjusted based on regime suitability scores. Each strategy’s weight is multiplied by its regime suitability score for the current detected regime, then renormalized. This soft adjustment tilts the portfolio toward strategies with demonstrated performance in the current market environment without completely excluding strategies with lower regime scores. Portfolio Construction Targets
- Sharpe Ratio:
 0
0 - Maximum Drawdown: < 15%
- Average Pairwise Correlation:
 3
3 - Regime-Conditional Sharpe:
 5 in all regimes
 - Number of Strategies: 3–8 (diversified but manageable)
7.3 Explainability and Audit Trail
Every portfolio decision generates a structured audit record containing: the user preference profile, the retrieved candidate set with scores, the LLM’s reasoning chain for each inclusion/exclusion decision, the weight allocation justifica-tion, tool call inputs and outputs, constraint validation results, and the Risk Manager’s approval reasoning. This audit trail supports compliance review, debugging, and user explanation.
8 Regime Awareness and Adaptive Selection
8.1 Regime Classification Framework
Market regimes represent distinct statistical states of financial markets characterized by different return distributions, correlations, and volatility profiles. The system classifies regimes along two primary dimensions: volatility level (high vs. low) and trend persistence (trending vs. mean-reverting), yielding four primary regimes plus a crisis/tail-risk regime. Regime classification uses a probabilistic model combining multiple indicators:
- VIX level: Above 25 indicates elevated volatility; above 40 indicates crisis.
- Realized volatility: 21-day realized volatility of major equity indices.
- Cross-asset correlation: Elevated correlations signal riskoff regimes.
- Momentum indicators: 12-1 month price momentum for trend detection.
- Macro indicators: Yield curve slope, credit spreads, PMI, inflation surprises.
8.2 Regime-Conditional Strategy Performance
Each strategy in the registry maintains regime-conditional performance metrics: Sharpe ratio, maximum drawdown, win rate, and average monthly return computed separately for each regime. These metrics are updated monthly as new data accumulates and as regimes transition. The regime suitability score for strategy s in regime r is computed as:

where RS(s,r) ≡ RegimeSuitability(s,r), DD(s,r) is the normalized maximum drawdown, Norm is the normalization constant, and the weights w1, w2, w3 sum to 1.0.
8.3 Adaptive Rebalancing
Regime transitions trigger portfolio re-evaluation workflows. When the regime detection tool reports a regime change with probability above a threshold (default 0.7), the Monitoring Agent activates the Orchestrator, which initiates a re-evaluation of the current portfolio. The re-evaluation follows the same workflow as initial construction but starts from the existing portfolio as a warm start, minimizing unnecessary turnover.
9 Real-Time Market Data Integration
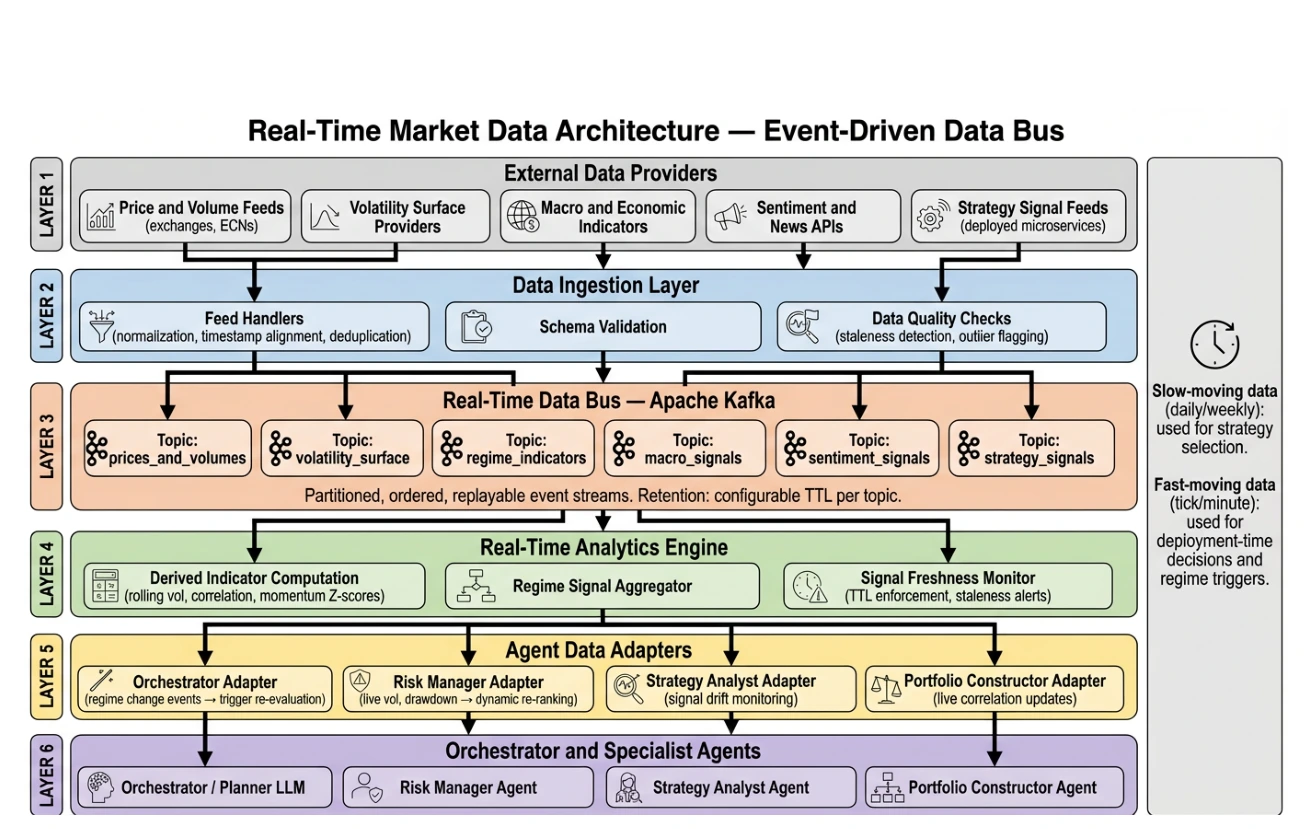
Figure 12 — Six-layer real-time market data architecture showing data ingestion, event bus, stream processing, agent adapters, and consumption patterns.
9.1 Data Ingestion Layer
The data ingestion layer maintains persistent connections to multiple market data providers:
- Bloomberg B-PIPE: Institutional-grade real-time prices, reference data, and news feeds for equities, fixed income, FX, and commodities.
- Refinitiv Elektron: Real-time and historical market data with tick-level granularity.
- Polygon.io: Cost-effective real-time and historical data for equities and options.
- Binance Data API: Cryptocurrency spot and derivatives price feeds, order book depth, and trade history for digital asset strategies, offering both REST and WebSocket interfaces with high rate limits. Connection protocols vary by provider: WebSocket for real-time streaming, FIX protocol for institutional feeds, and REST polling for lower-frequency data. A data normalization layer converts provider-specific formats into a unified internal schema.
9.2 Event-Driven Data Bus
Apache Kafka serves as the central event bus, organizing data streams into typed topics:
Kafka Topics
| Topic | Contents |
|---|---|
market.prices | Real-time OHLCV tick data |
market.volumes | Trade volume and order flow |
market.volatility | VIX, realized vol, vol surfaces |
market.regime_signals | Regime indicator updates |
strategy.signals | Live strategy signal feeds |
portfolio.performance | Real-time PnL and metrics |
system.alerts | Threshold breach notifications |
Kafka’s distributed architecture ensures high throughput (millions of events per second), fault tolerance (replication across brokers), and flexible consumer group management (multiple agents consuming the same stream independently).
9.3 Stream Processing Layer
Apache Flink processes raw market data streams to compute derived indicators consumed by agents:
- Rolling volatility: 5-minute, 1-hour, and 1-day realized volatility windows.
- Regime indicators: Continuous updates to VIX, correlation, and momentum signals.
- Signal quality metrics: Real-time IC computation between live signals and short-term forward returns.
- Portfolio metrics: Rolling Sharpe, drawdown, and correlation of the live portfolio.
- Anomaly detection: Statistical process control on signal distributions to detect strategy drift.
9.4 Agent Data Consumption Patterns
Different agents consume real-time data with different patterns and latency requirements:
Risk Manager: Continuous polling of regime indicators and portfolio performance metrics. Alert thresholds trigger immediate re-evaluation workflows. Latency requirement: sub-second for breach detection.
Strategy Analyst: Streaming consumption of signal quality metrics to update strategy rankings dynamically. Latency requirement: minutes for ranking updates.
Portfolio Constructor: On-demand access to current correlation matrices and volatility estimates when constructing or rebalancing portfolios. Latency requirement: seconds for on-demand queries.
Monitoring Agent: Continuous consumption of portfolio performance and strategy signal streams. Computes rolling metrics and generates performance reports. Latency requirement: sub-minute for performance tracking.
9.5 Slow-Moving vs. Fast-Moving Data
The system distinguishes between slow-moving data (used for portfolio construction decisions) and fast-moving data (used for live monitoring and rebalancing triggers):
- Slow-moving: Monthly performance updates, quarterly correlation matrix refreshes, regime classification (updated daily). Used by Strategy Analyst and Portfolio Constructor.
- Fast-moving: Real-time price feeds, intraday volatility, live strategy signals. Used by Risk Manager and Monitoring Agent. This distinction prevents over-trading from high-frequency noise while ensuring the system responds appropriately to significant market regime changes.
10 Strategy Microservice Architecture
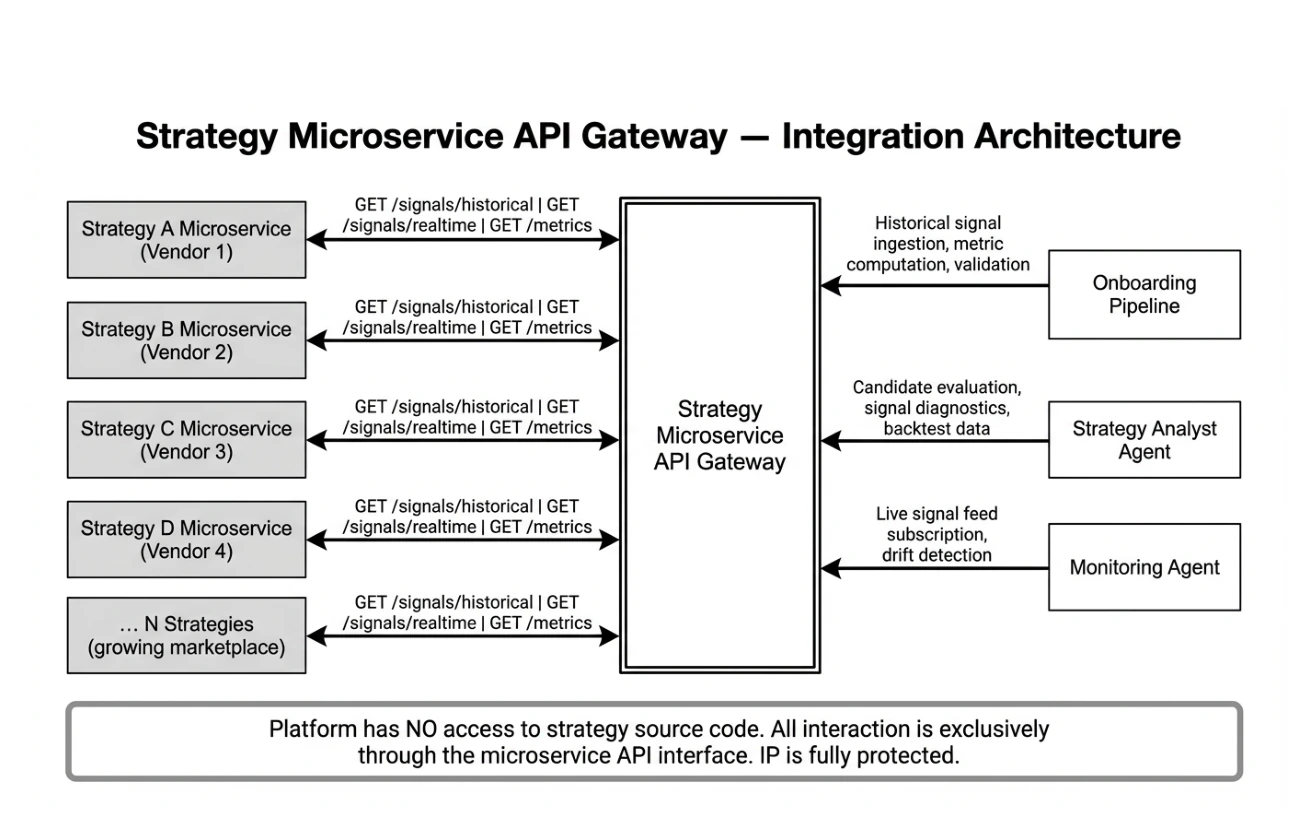
Figure 13 — Strategy microservice API gateway architecture showing the platform’s interface with third-party vendor microservices.
10.1 Vendor IP Protection Model
The microservice architecture is designed with vendor IP protection as a first-class constraint. Third-party strategy vendors expose only two API endpoints: a historical signals endpoint returning time-series signal data for a specified date range, and a live signals endpoint returning the current signal for real-time consumption. No source code, model weights, feature engineering logic, or internal parameters are accessible to the platform.
The platform derives all strategy intelligence from: the signal time series (from which performance metrics are computed), vendor-provided metadata (strategy description, asset class, intended market conditions), and the platform’s own backtesting and analysis tools applied to the signal data.
10.2 API Gateway Design
The API gateway manages all communication between the platform and vendor microservices:
- Authentication: OAuth 2.0 with per-vendor API keys and rate limiting.
- Schema validation: All API responses are validated against registered schemas before processing.
- Caching: Historical signal data is cached to avoid redundant API calls; cache invalidation is triggered by vendor signal updates.
- Fallback handling: If a vendor API is unavailable, the system uses cached historical signals and flags the strategy as “signal-stale” in the registry.
- Monitoring: Latency, availability, and schema compliance are monitored per vendor.
11 Deployment Pipeline
11.1 Portfolio Signal Generation
The Deployment Agent translates the validated portfolio specification into a structured signal package for the execution microservice. The signal package contains: portfolio ID and timestamp, strategy weights as a normalized vector, signal metadata for each strategy (asset class, signal type, expected holding period), risk parameters (maximum position size, stop-loss levels), and a validity window (how long the signals remain actionable before re-evaluation).
11.2 Execution Microservice Interface
The proprietary execution microservice receives the signal package via a secure REST endpoint. The interface is unidirectional from the agentic system’s perspective: signals are transmitted and acknowledged, but execution details (order routing, fill prices, position management) are not returned to the agentic layer. This clean separation ensures the execution microservice can be upgraded or replaced without affecting the agentic system’s logic.
11.3 Post-Deployment Monitoring Setup
Upon successful signal transmission, the Deployment Agent configures the Monitoring Agent with: the deployed portfolio specification, performance thresholds for breach detection (drawdown limit, Sharpe floor, correlation ceiling), regime transition sensitivity (how large a regime shift triggers reevaluation), and a re-evaluation schedule (periodic review regardless of threshold breaches).
12 Continuous Onboarding and Marketplace
12.1 Six-Stage Onboarding Pipeline
New strategy vendors enter the marketplace through a six-stage onboarding pipeline that validates quality, computes metadata, and registers the strategy in the vector-indexed registry.
- Vendor Submission: Vendor provides strategy description, asset class tags, microservice endpoint URL, authentication credentials, and historical performance claims. A standardized submission form ensures metadata completeness.
- API Connectivity Validation: The platform tests endpoint reachability, authentication, response schema compliance, and latency. Strategies failing connectivity validation are rejected with specific error messages.
- Historical Signal Ingestion: The platform retrieves 3 years of historical signals via the historical signals API. Data quality checks verify signal completeness (no gaps exceeding 5 trading days), signal range validity (no extreme outliers), and timestamp consistency.
- Performance Metric Computation: The backtesting engine computes the full performance metric suite: Sharpe ratio, maximum drawdown, annualized return, volatility, win rate, profit factor, Calmar ratio, and all regime-conditional variants. Vendor performance claims are com-pared against platform-computed metrics; significant dis-crepancies trigger a review flag.
- Signal Quality Assessment: The signal quality analyzer computes information coefficient, IC stability, signal decay half-life, hit rate, and turnover. Strategies with IC below 0.03 or IC stability below 0.5 are flagged as low-quality and may be excluded from the marketplace.
- Registry Registration: Passing strategies are registered in the strategy registry: metadata stored in PostgreSQL, embeddings generated and indexed in the vector database, correlation matrix updated to include the new strategy, and the strategy listed as active in the marketplace.
12.2 Marketplace Scaling
The system is designed to scale to hundreds of strategies without degrading recommendation quality. Key scaling mech-anisms include: approximate nearest neighbor search for sublinear retrieval scaling, asynchronous metadata updates (correlation matrix, regime metrics) running as background jobs, and hierarchical clustering of strategies to enable efficient portfolio diversification at scale.
13 System Design Tradeoffs
13.1 LLM Reasoning vs. Deterministic Optimization
The central design choice is the balance between LLM reasoning and deterministic optimization. Pure LLM approaches offer flexibility and natural language explainability but risk hallucination and inconsistency. Pure optimization approaches offer mathematical guarantees but lack flexibility for complex, multi-objective problems with natural language constraints. The hybrid approach adopted here uses LLMs for strategic judgment (candidate selection, weight allocation rationale, constraint interpretation) and deterministic tools for numerical validation (metric computation, constraint checking). This combination achieves both explainability and reliability.
13.2 Latency vs. Thoroughness
Portfolio construction involves a latency-thoroughness tradeoff. More comprehensive analysis (larger candidate sets, more stress scenarios, longer reasoning chains) improves decision quality but increases latency. The system addresses this through: tiered analysis (fast initial screening followed by deep analysis of finalists), parallel agent execution where possible, and caching of frequently accessed data (correlation matrices, regime metrics).
13.3 Microservice Isolation vs. Information Access
The microservice model provides strong IP protection but limits the platform’s access to strategy intelligence. The platform cannot inspect strategy logic, understand why signals are generated, or predict how signals will behave in novel market conditions. This limitation is addressed through: comprehensive signal-based analysis (extracting maximum intelligence from observable signals), regime-conditional performance tracking (understanding signal behavior across market states), and conservative portfolio construction (maintaining diversification as a hedge against unknown strategy behavior).
13.4 Explainability vs. Complexity
More sophisticated portfolio construction methods (e.g., hierarchical risk parity, Black-Litterman) may improve performance but reduce explainability. The system prioritizes explainability by using simpler, transparent construction methods that can be fully explained in natural language, with complexity added only where it can be clearly communicated to users.
14 Implementation Roadmap
The system is designed for phased implementation over 18 months, with each phase delivering usable functionality while building toward the full vision.
14.1 Phase 1: Core Infrastructure (Months 1–3)
Establish foundational components: strategy registry schema and database setup, API gateway with authentication and schema validation, basic Orchestrator and User Profiler agents with conversational elicitation, backtesting engine integration, and a prototype marketplace with 10–20 strategies. Deliverable: end-to-end workflow from user conversation to portfolio recommendation (without live deployment).
14.2 Phase 2: Specialist Agents (Months 4–6)
Implement the full specialist agent suite: Strategy Analyst with RAG pipeline, Portfolio Constructor with chain-ofthought reasoning, Risk Manager with stress testing, regime detection tool, and correlation engine. Deliverable: full portfolio construction workflow with validation and explainability.
14.3 Phase 3: Real-Time Integration (Months 7–9)
Integrate real-time market data: Kafka event bus setup, stream processing layer, Deployment Agent with execution microservice interface, Monitoring Agent with threshold detection, and paper trading validation. Deliverable: live deployment capability with real-time monitoring.
14.4 Phase 4: Scaling and Optimization (Months 10–12)
Scale the marketplace: continuous onboarding pipeline, vector database optimization for 100+ strategies, performance optimization (latency, throughput), and system monitoring and alerting. Deliverable: production-ready system with 100+ strategies.
14.5 Phase 5: Advanced Features (Months 13–18)
Advanced capabilities: regime transition modeling, enhanced explainability for compliance, multi-asset portfolio construction, user customization (custom constraints, preferred vendors), and advanced analytics dashboard. Deliverable: full-featured production system with competitive differentiation.
15 Metrics and Evaluation
15.1 Portfolio Performance Metrics
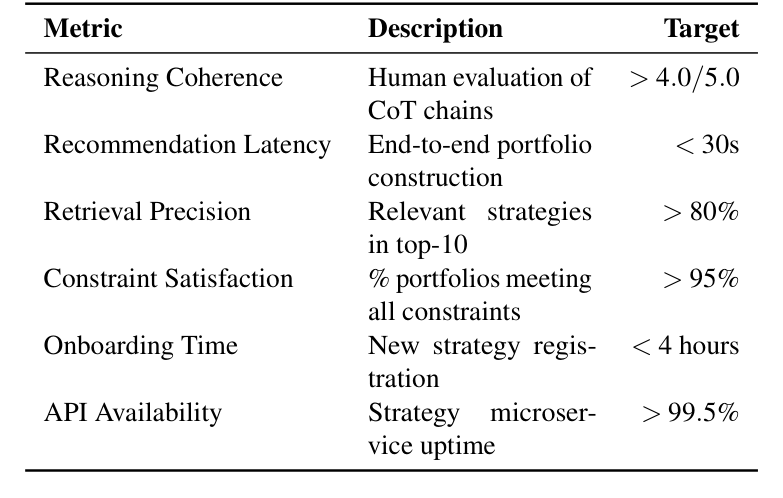
15.2 System Quality Metrics
15.3 Composite Evaluation Score
The composite evaluation score combines portfolio and system metrics into a single scalar for benchmarking:

where Ŝ is normalized Sharpe, D̂ is normalized drawdown (inverted), Ĉ is normalized correlation (inverted), R̂ is normalized regime-conditional Sharpe, and Q̂ is normalized reasoning coherence. The target composite score is > 0.75.
16 Conclusion
The six-agent architecture—Orchestrator, User Profiler, Strategy Analyst, Portfolio Constructor, Risk Manager, and Deployment Agent—decomposes the complex portfolio construction task into manageable, specialized responsibilities.
Each agent is optimized for its specific function while con-tributing to a coherent end-to-end workflow. The three-layer memory architecture balances computational efficiency with information retention, enabling both responsive conversational interaction and deep analytical reasoning.
The real-time market data integration layer enables the system to adapt dynamically to changing market conditions, adjusting strategy suitability scores and triggering portfolio re-evaluation when regime transitions occur. The continuous onboarding pipeline ensures the marketplace grows in quality as well as quantity, maintaining high standards for signal quality and performance consistency.
The 18-month implementation roadmap provides a practical path from prototype to production, with each phase delivering usable functionality. The composite evaluation framework provides clear success criteria for measuring system performance across both portfolio quality and reasoning quality dimensions.
Looking forward, the system’s LLM-based architecture posi-tions it to benefit from ongoing advances in model capability: longer context windows enable richer strategy metadata analysis, improved reasoning enables more sophisticated portfolio construction, and lower inference latency enables real-time decision making. As the strategy marketplace grows and model capabilities advance, the system’s value proposition strengthens, creating a virtuous cycle of improving recommendations and growing vendor participation.
The microservice model enables a vibrant ecosystem where third-party vendors contribute strategies while retaining IP protection, accelerating innovation in quantitative finance. By combining the interpretability of LLM reasoning with the reliability of deterministic tools, and the flexibility of natural language interfaces with the rigor of quantitative validation, this system represents a significant advance in the state of the art for automated portfolio construction.
Implementation Considerations Across LLM Providers While the architecture described in this work is LLM-agnostic in principle, practical implementation will differ meaningfully depending on the underlying model provider. These differences span context window capacity, function-calling reliability, reasoning depth, and latency, each of which has direct implications for agent design.
OpenAI (GPT-4.1 / o3) offers the most mature function-calling and tool-use ecosystem, with structured output enforcement via JSON schema and a large context window (up to 1M tokens in GPT-4.1). The Orchestrator and Portfolio Constructor agents benefit particularly from OpenAI’s reliable multi-step tool chaining. The o3 reasoning model introduces extended chain-of-thought computation natively, making it well-suited for the Portfolio Constructor’s iterative weight allocation loop where deliberate, multi-step reasoning is critical. However, o3 incurs higher latency per call, which must be accounted for in the system’s real-time monitoring components.
Anthropic Claude (Claude 3.7 / Claude 4 Sonnet) excels at long-document comprehension and nuanced instruction following, making it a strong candidate for the Strategy Analyst agent where large volumes of strategy metadata must be parsed and synthesized. Claude’s extended context (up to 200K tokens) is advantageous when augmenting prompts with full strategy registry excerpts during RAG. Claude 3.7 Sonnet’s hybrid reasoning mode—toggling between standard and extended thinking—offers a useful tradeoff between latency and depth for the Risk Manager’s validation tasks, while Claude 4 Sonnet further improves agentic task completion and multi-step reliability. Implementers should note that Claude’s tool-use schema differs from OpenAI’s, requiring adapter layers in the tool integration layer.
Moonshot AI Kimi (kimi-k2.5) represents a strong option for deployments prioritizing cost efficiency and multilingual support, particularly for Asian financial markets. Kimi k2.5’s long-context capabilities and competitive reasoning bench-marks make it suitable for the User Profiler agent in multilingual environments. However, its function-calling ecosystem is less mature than OpenAI’s or Anthropic’s, and implementers should invest in additional prompt engineering and output parsing robustness. Kimi’s lower inference cost also makes it attractive for the Monitoring Agent, which runs continuously and accumulates significant token volume over time.
In practice, a heterogeneous deployment—using different LLMs for different agents based on their specific requirements—is likely to yield the best balance of performance, cost, and reliability. The system’s modular agent architecture is designed to accommodate this: each agent’s LLM backend can be configured independently, allowing operators to substitute models as capabilities evolve without restructuring the broader workflow.