← Back to draft
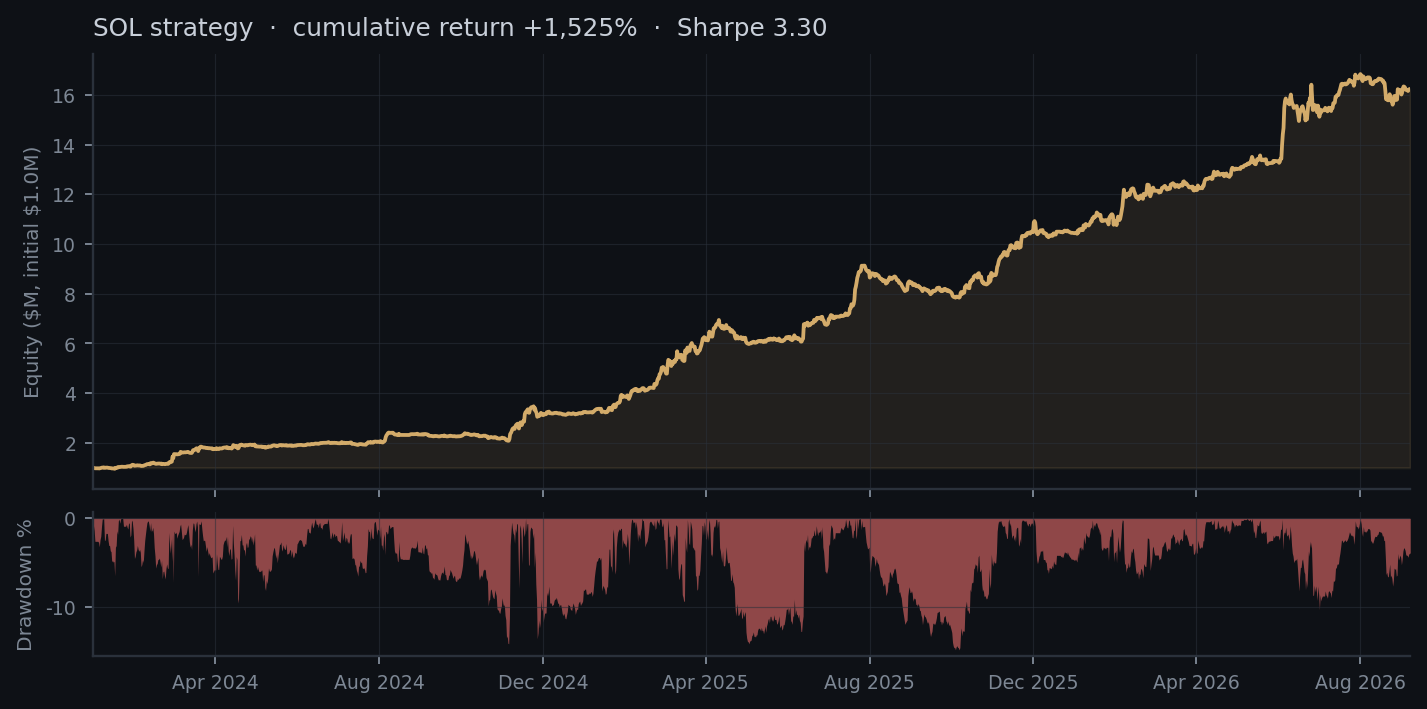
SOL Research Equity Chart
SOL · Equity indexed to 100% · Drawdown unchanged
1,600%
1,400%
1,200%
1,000%
800%
600%
400%
200%
Starting equity = 100%. Original research curve; axis units normalized. Historical backtest, Jan 2024 – Sep 2026; 300% target gross exposure. Past performance does not guarantee future results.