A Transformer that reads the regime
Tensor’s custom architecture conditions forecasts on whether the market is trending up, trending down or ranging. The same price pattern can mean different things in different market states.
 Trading Evolved

A new standard in
deep-learning directional trading.
The market is non-stationary and chaotic. Adapt every decision based on a dynamic system.
A premium strategy series developed by Tensor, with regime-aware intelligence from entry to exit.
01 / The philosophy
Markets are non-stationary and chaotic. Archimedes is designed to adapt its decisions as the relationships between price, liquidity and volatility change.
Archimedes pairs a proprietary, regime-aware time-series Transformer with an adaptive, unsupervised exit engine. It reads trend, range and volatility before deciding how to enter, size, hold and exit a position.
Each preview strategy is a portfolio of complementary long and short sub-strategies, spanning trend, mean-reversion and volatility regimes, with upgraded shorting capability relative to earlier engines such as Hackworth.
02 / The engine
From reading the market to managing the last fill, Archimedes brings prediction, portfolio construction and execution into one adaptive system.
Tensor’s custom architecture conditions forecasts on whether the market is trending up, trending down or ranging. The same price pattern can mean different things in different market states.
A proprietary, lightweight unsupervised model continuously re-evaluates open positions. Across the preview strategies, 72–83% of exits were model decisions rather than stop-loss triggers.
Curated inputs span price action, market microstructure, volatility and cross-asset context, giving the model a broad view of the state it is trading.
Each strategy combines directional, mean-reversion and volatility sleeves, with balanced long/short exposure and improved shorting capability relative to earlier engines such as Hackworth.
A deep reinforcement learning execution layer uses dynamic TWAP to slice orders, accelerating when liquidity is deep and backing off when it is thin.
Every sub-strategy is evaluated independently through standalone Sharpe, parameter perturbations, trade bootstraps, matched-control exit benchmarks and year-by-year stability checks.
03 / The preview strategies
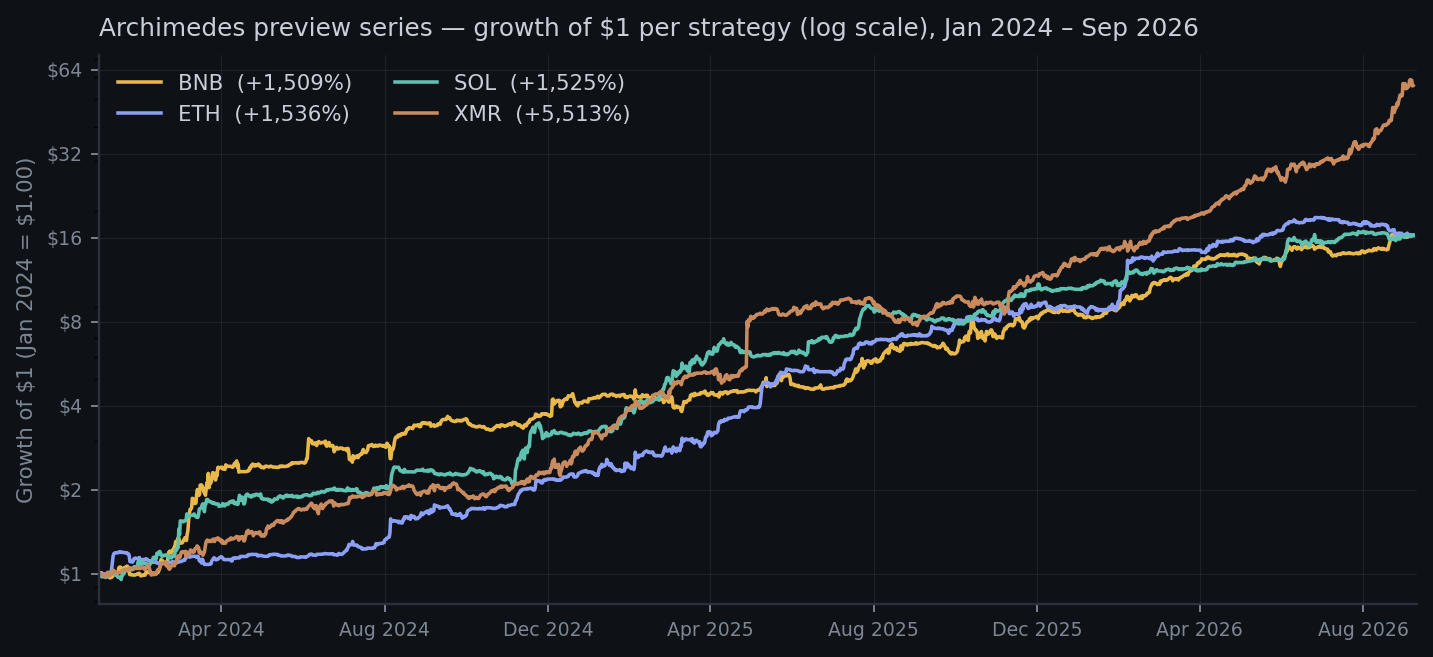
Four frozen portfolios, evaluated under the same protocol. Explore the historical results, then open each strategy for its equity curve and benchmark findings.
| Strategy | Cumulative return | Sharpe ratio | Max drawdown | Win rate | Profit factor | Trades |
|---|---|---|---|---|---|---|
| BNB | +1,509% | 2.89 | −21.8% | 59.5% | 1.50 | 2,184 |
| ETH | +1,536% | 3.54 | −16.3% | 49.6% | 1.80 | 1,287 |
| SOL | +1,525% | 3.31 | −15.4% | 55.9% | 1.43 | 2,297 |
| XMR | +5,513% | 3.87 | −21.8% | 65.4% | 1.66 | 3,692 |
Frozen sub-strategy portfolios; no re-optimization during the test window. Baseline conditions, with Hyperliquid execution using deep-RL dynamic TWAP. These are backtest results, not live returns. Historical performance does not guarantee future results.
Sharpe ratioReturn relative to risk. The preview series spans 2.89–3.87.
Maximum drawdownThe largest peak-to-trough decline in the account’s value during the backtest.
Win rateThe share of trades that closed profitably.
Profit factorGross profits divided by gross losses. A factor of 1.50 means gross profits were 150% of gross losses.
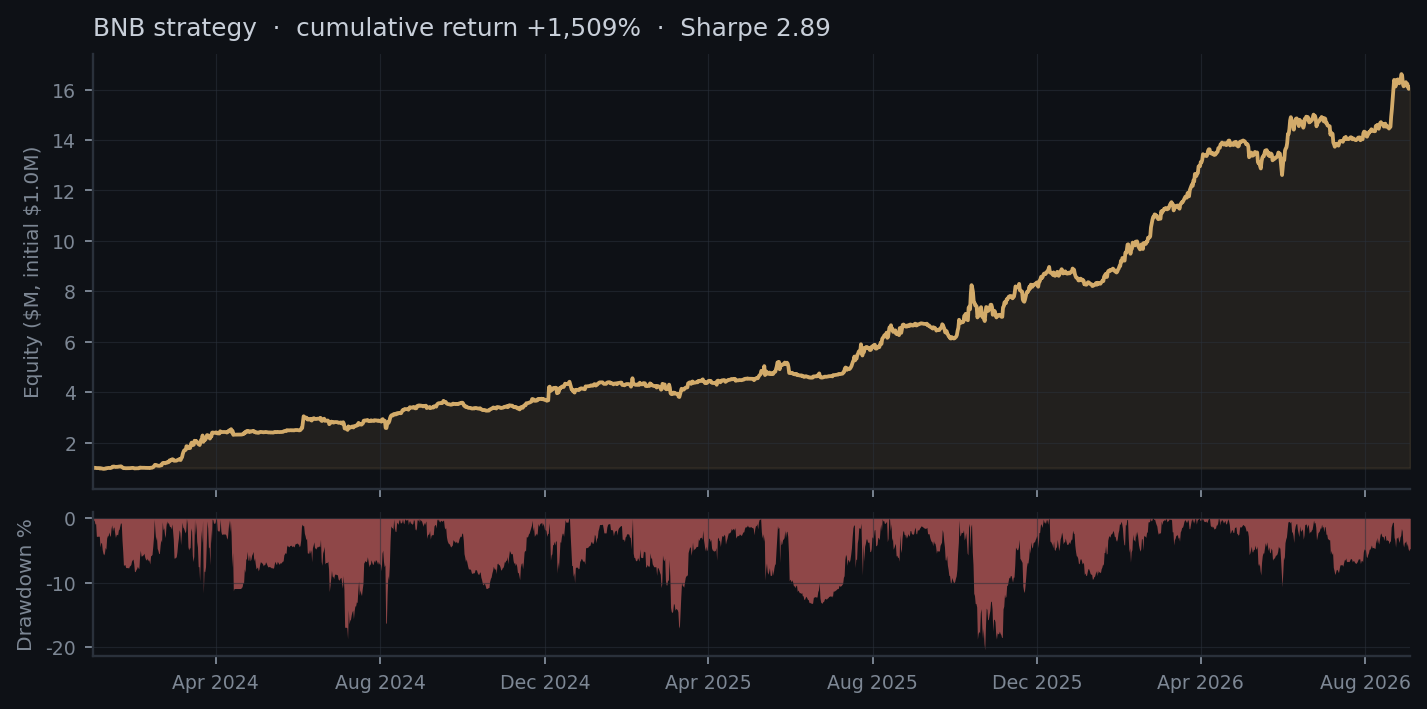
Frozen portfolio backtest, Jan 2024 – Sep 2026 · initial equity indexed to 100% · 300% target gross exposure · baseline conditions. Exit benchmark: 1,743 matched control events. Historical results do not guarantee future performance.
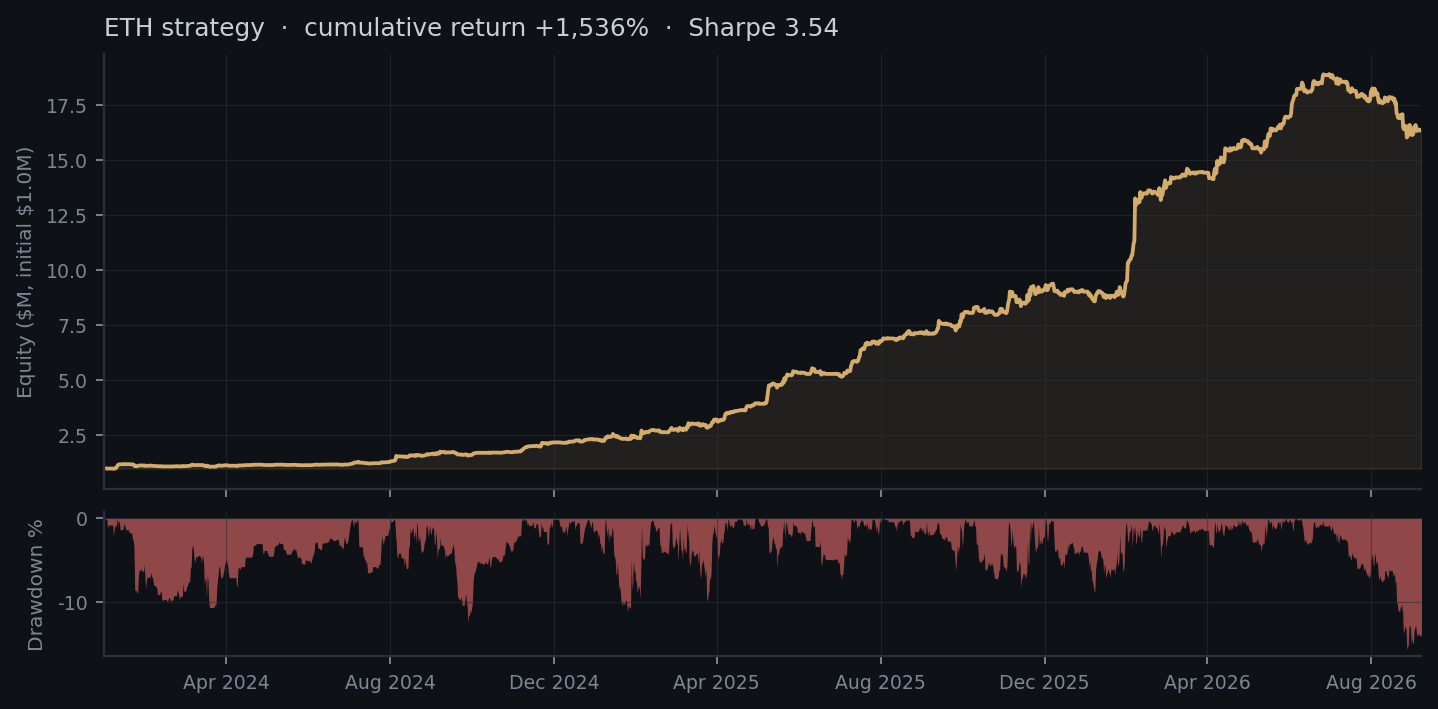
Frozen portfolio backtest, Jan 2024 – Sep 2026 · initial equity indexed to 100% · 300% target gross exposure · baseline conditions. Exit benchmark: 1,065 matched control events. Historical results do not guarantee future performance.
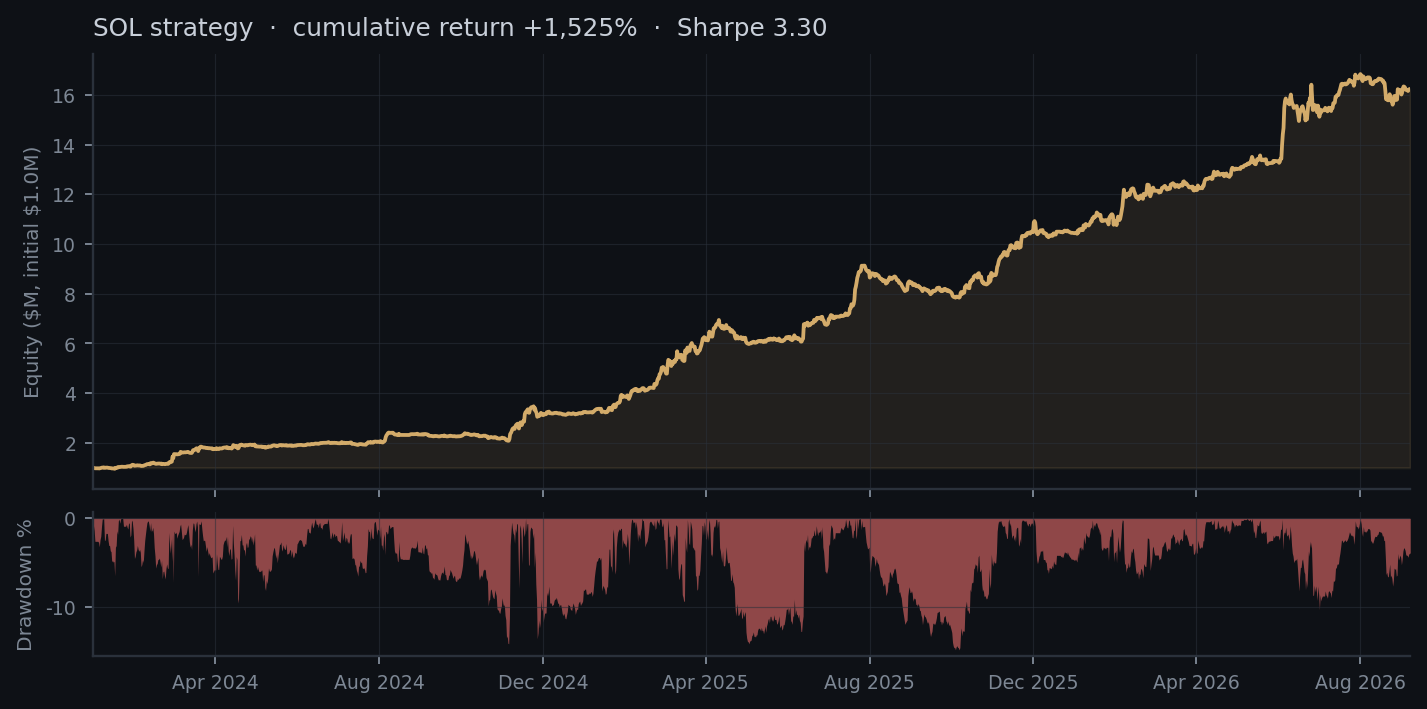
Frozen portfolio backtest, Jan 2024 – Sep 2026 · initial equity indexed to 100% · 300% target gross exposure · baseline conditions. Exit benchmark: 1,645 matched control events. Historical results do not guarantee future performance.
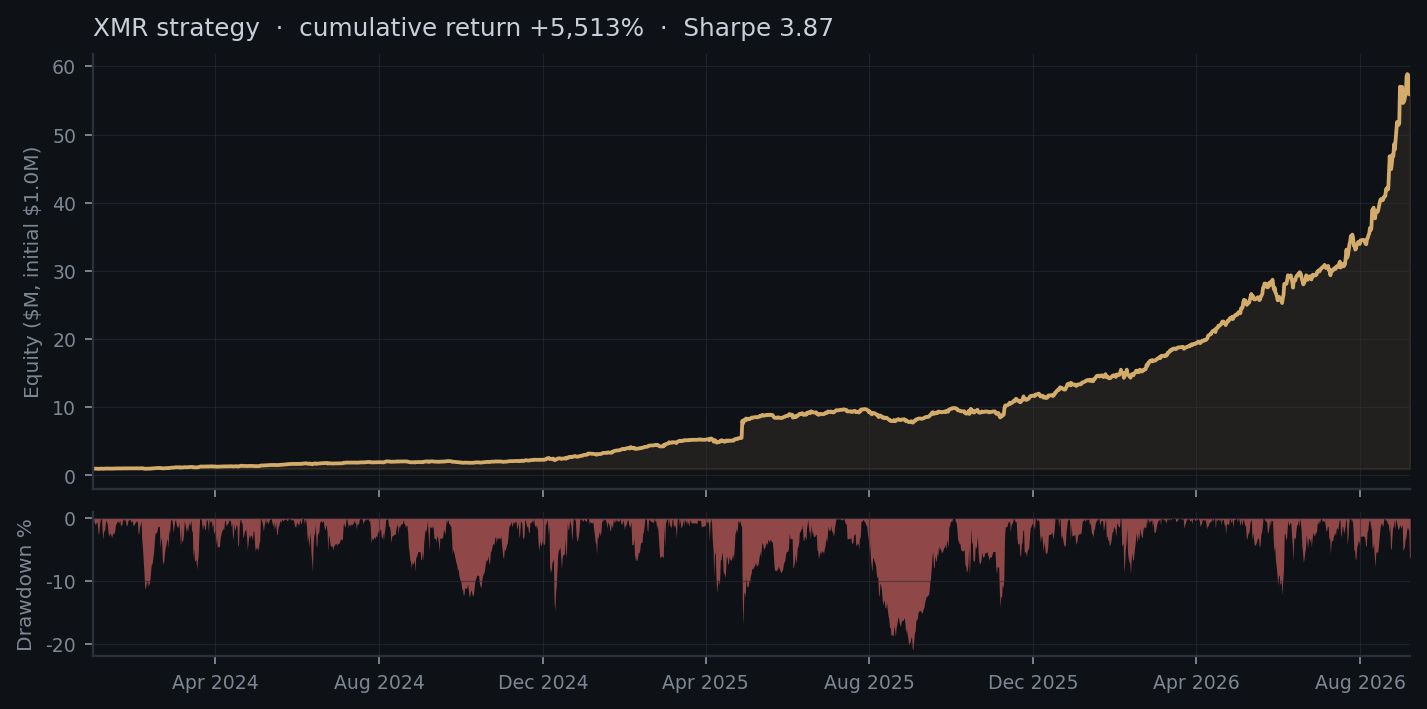
Frozen portfolio backtest, Jan 2024 – Sep 2026 · initial equity indexed to 100% · 300% target gross exposure · baseline conditions. Exit benchmark: 2,870 matched control events. Historical results do not guarantee future performance.
04 / The proving ground
A strong portfolio result is only the beginning. Each selected sub-strategy signal was evaluated independently.
Each signal exceeded a standalone Sharpe ratio of 1.0.
Model exits were compared with matched “what if we held” controls to measure the value of closing the position.
Parameter tests demonstrated robustness under the tested stress conditions.
Trade histories were resampled to assess whether results remained consistent across different historical samples.
Every sub-strategy was re-scored year by year, covering 2024, 2025 and 2026 to date.